Thanks for having me Blue. Uploading to HC server? Have I missed something?
Just had another look at the DJT 30 min posted earlier and a H&S jumped out at me. Why didn't I see that before? Imho its bearish implications would outweigh the bullish set up into the close at support. How that plays out might be something to watch early in the week for direction? I guess with current volatility futures will be all over the place again before the open. Still seems clear that if the big sell off was on here to new lows, DJT would have sold off more than it did and not closed like that.
That said, here is the SP500 daily and Thursday's high at calculated resistance again. Lower trend line still in place. It didn't break it Friday so it is still in the channel until it isn't. Perhaps futures will look awful and frighten Asia only to pick up after close and then open strong and off to the races?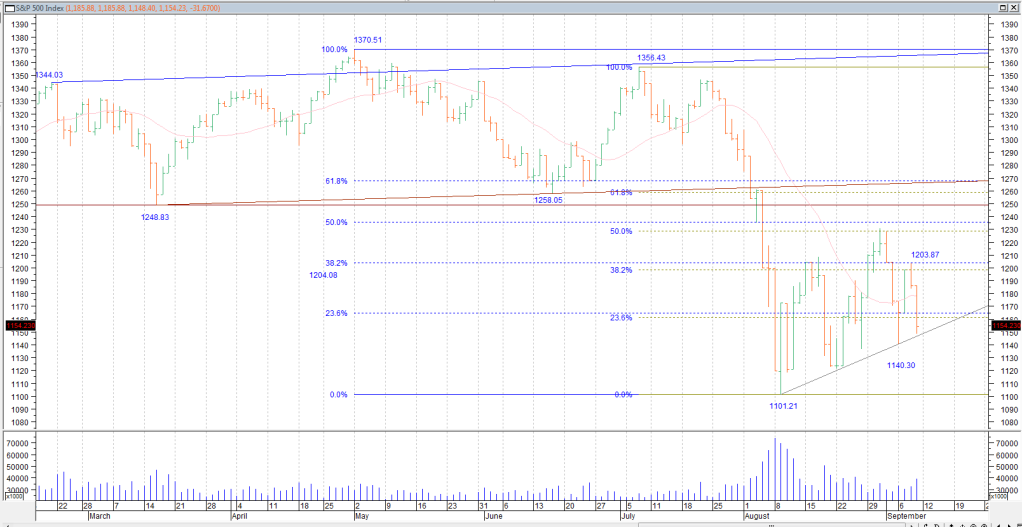
a few charts of interest, page-20


Add XJO (ASX) to my watchlist
 (20min delay) (20min delay)
|
|||||
|
Last
8,091.9 |
Change
46.800(0.58%) |
Mkt cap ! n/a | |||
| Open | High | Low |
| 8,045.1 | 8,091.9 | 8,045.1 |
| XJO (ASX) Chart |