redbacka,
I have also questioned the use of the raw volume numbers for VSA, it's in my nature to question things.
I agree it just doesnt seem right, especially when you know the reason behind that volume.
However, It just seems to play out as you would expect, I dont know why, it just does.
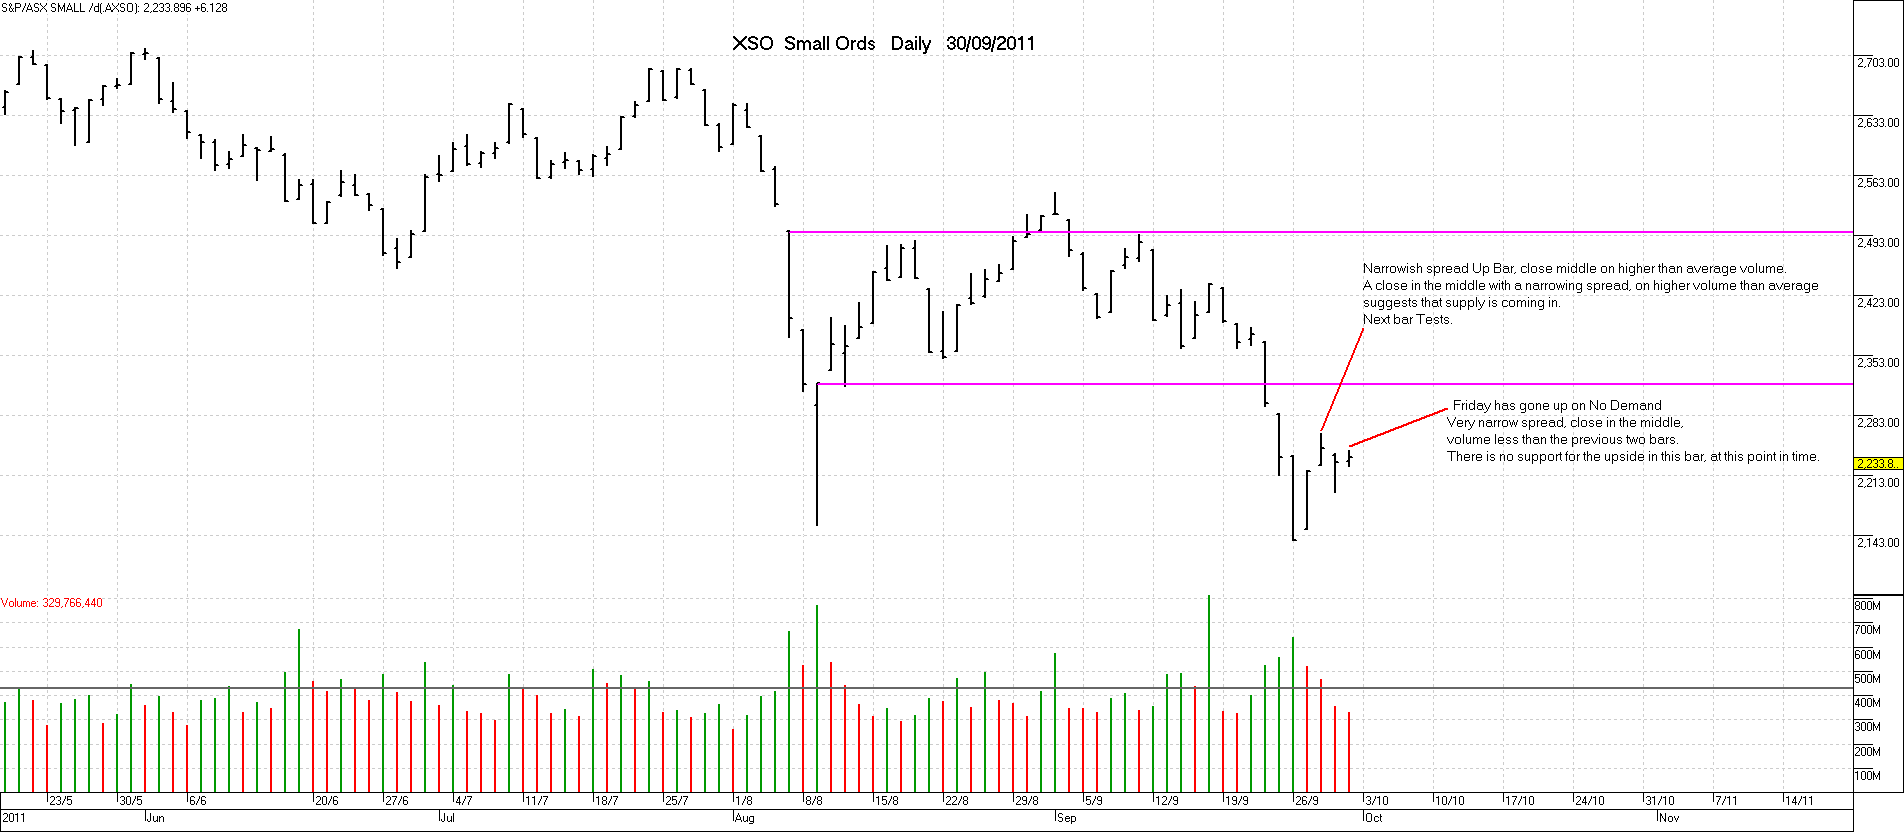
I've had a look at the XSO.
XSO Daily
Different indicator, similar sign, Weakness
I would also like to point out (for anyone who is not aware), VSA is only indicating what may happen in the next bar or two in whatever time frame you are working in.
So if VSA indicates Weakness in a particular bar, we are expecting that the probability of the next bar to be down is higher than up.
If the following bars are also weak, the down or sideways trend would be expected to continue, until some sign of strength appears, which may change the trend.
As Funky has said, "markets can turn on a dime".
If I was to rate the last bar on the XJO out of ten,
where 10 is very Bearish and 1 is very bullish,
I would rate Fridays bar as eight and a half, or 85% chance of being lower on Monday.
Anyone else want to put a rating in ??
cheers
- Forums
- ASX - By Stock
- XJO
- xjo weekend zoomba lounge
xjo weekend zoomba lounge, page-162
-
- There are more pages in this discussion • 45 more messages in this thread...
You’re viewing a single post only. To view the entire thread just sign in or Join Now (FREE)
Featured News
Add XJO (ASX) to my watchlist
 (20min delay) (20min delay)
|
|||||
|
Last
8,214.5 |
Change
-8.500(0.10%) |
Mkt cap ! n/a | |||
| Open | High | Low |
| 8,223.0 | 8,228.3 | 8,200.0 |
Featured News
| XJO (ASX) Chart |


