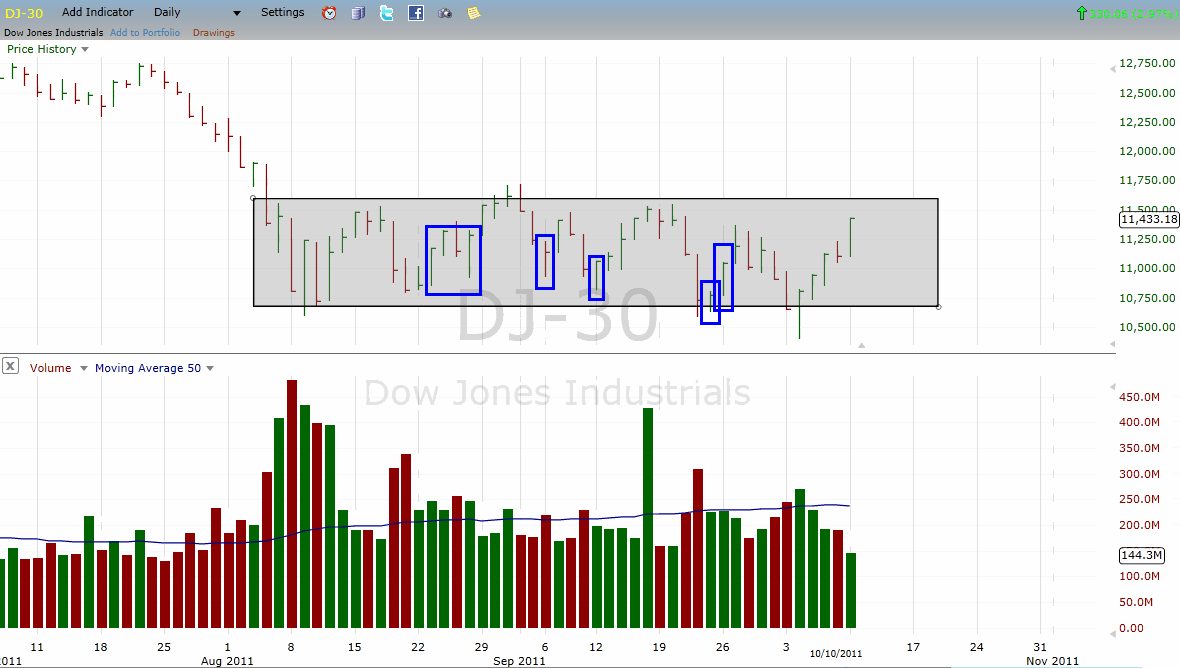
"...I see Mitta's trend line on volume is pointing upward, and daily volume is in line with longer term amounts through March April May .."
Johnny, if I'm correct you'd be highlighting the 'average volume line'?
if so, yes it is on a slight rise, but imo it's not much of a guide, as it's really where the actual volume, in this case an increase is at ie. on downbars or upbars, their spreads and closes etc blah blah
most this morning are looking at just the recent low volume rise, in this chart of the DOW, I've highlighted the TR and looked within it for what is dominating imo atm ie. supply or demand
also I've disregarded the initial HUGE volume that stopped it's fall, that's it over to the extreme left, which is always hard to know what it's made up of
imo there's more supply or in another way of saying it, the weakness is strongest
the longer this range goes for the less bullish it will be, but it's also quite difficult to judge that until we see some more clues appear
cheers

Add to My Watchlist
What is My Watchlist?


