Here is the 2008 comparison again and interesting to note that there was a high on day 75 from initial low. Today is 75 days from 9/8/11 low so will history repeat again? Is it also an omen that the low of the false break in 2008 was 75% of 1 point off today's high (1256.55 but there's an hour of trading to go)? Very strange indeed!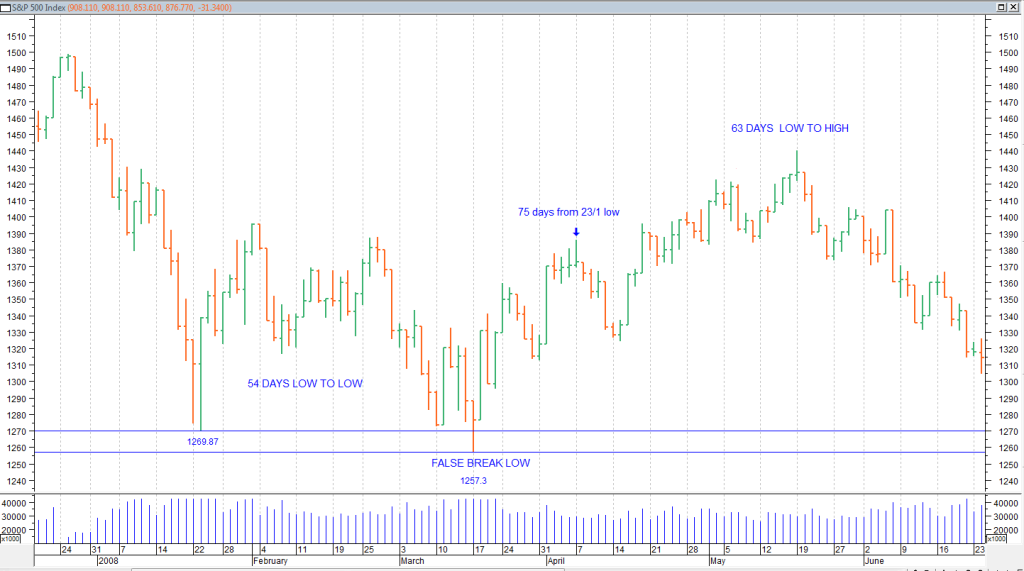


Add to My Watchlist
What is My Watchlist?
 (20min delay) (20min delay)
|
|||||
|
Last
8,626.0 |
Change
55.600(0.65%) |
Mkt cap ! n/a | |||
| Open | High | Low |
| 8,570.4 | 8,632.6 | 8,570.4 |
| XJO (ASX) Chart |