I'm still trying to get my head around how yotta worked out that equation he posted earlier. Freakin' amazing man!
Not sure if people are that interested in NDX but I'll keep posting stuff on it anyway.
It is said to be a leader and last night it finished down, mainly due to Apple being sold down for the reason that they can't produce the stuff quick enough to meet demand, so the story goes.
In mid to late October, it put in what looks to be a three thrust topping pattern and a secondary high 3 months + 1 day (93 days) after the post GFC high. That is a recognised cycle right there - high to high.
Since then, there is another lower high this Tuesday and overnight it came within 3 points of making a lower low.
As noted last time I posted this index, there was a high on 16/2/2011 at 2403.52 which was inside a point of this Tuesday's high, so it seems that this index has been distributing all that time (now 268 trading days). Noted 270 days is this Saturday.
So what is the point? I can't see this index going from here straight to a new highs without more downside. First, it needs Apple, and second, the chart says to me that the odds are really stacked up against it.
Same chart with candles. The last 2 candles don't look too flash to me.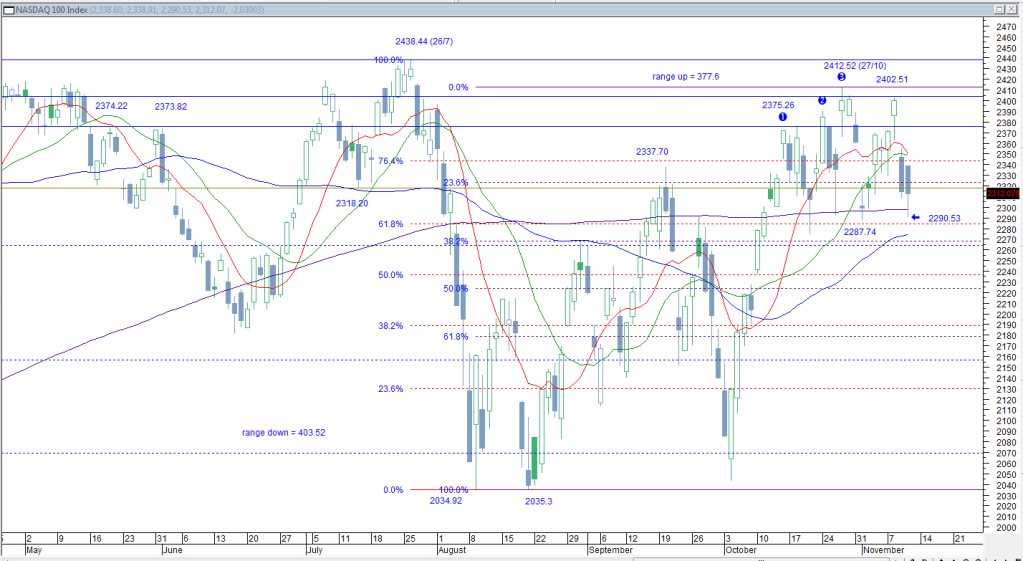
chris fords rambo friday - 11/11/11, page-84


Add XJO (ASX) to my watchlist
 (20min delay) (20min delay)
|
|||||
|
Last
8,075.7 |
Change
87.800(1.10%) |
Mkt cap ! n/a | |||
| Open | High | Low |
| 7,987.9 | 8,079.0 | 7,979.5 |
| XJO (ASX) Chart |