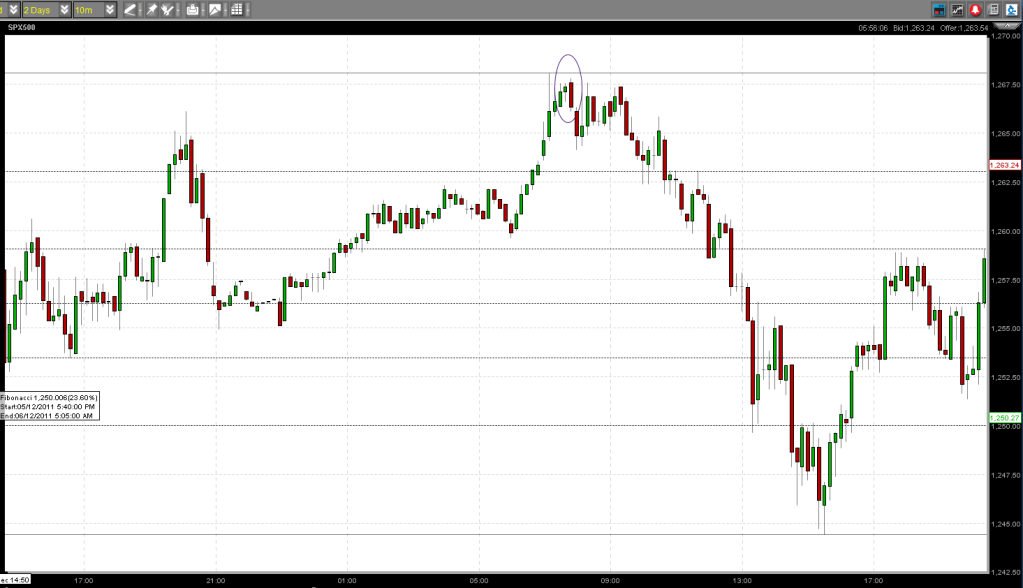
SPX 10 min from last night and you can see the candle which sounded the warning of the pending sell off in the oval - falling enveloping candle at a high level.
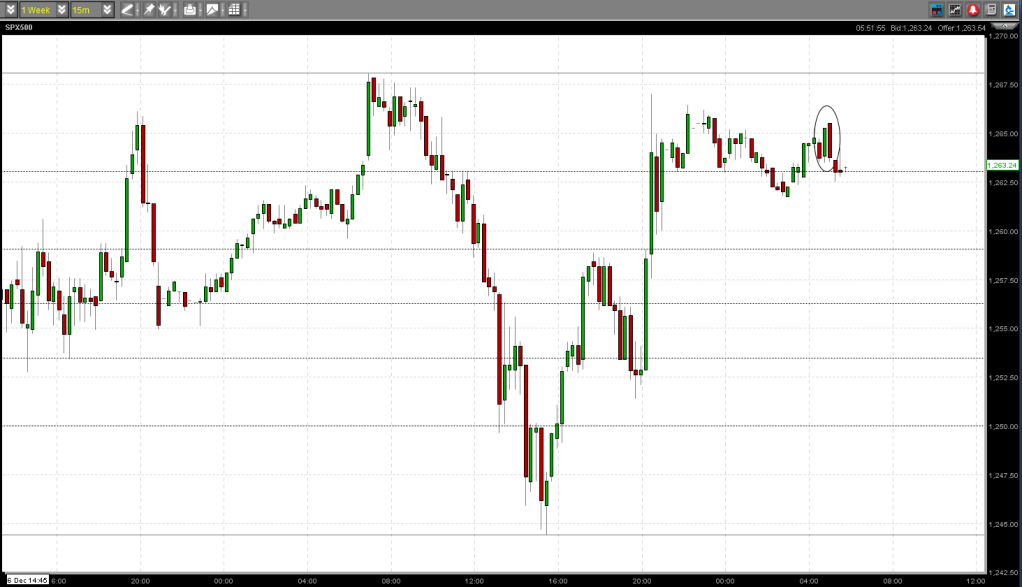
Current position SPX 15 min and another of the same candles in the oval at a high level, although the low is the same level (actually 0.01 of a point higher) than the prior candle (that may reduce the candle's significance a tad). I will look at different timeframes to find them. The larger the timeframe the more significant the candle, so in theory, this recent one should be a better indicator than the one last night, but note this one's low is not lower than the prior candle which should reduce its significance...conflicting data so we’re still confused.
Add to My Watchlist
What is My Watchlist?


