out on a limb here, showing you all my thoughts via writing's on the chart
but ask yourself this:
if you know anything about ew, and if you know anything about fibb's, and if you know anything about market psychology particularly that surrounding a wave 2 low, then what does the chart tell you?
forget what anyone says, including the eminently capable and wonderfully erudite writers in that oh so thorough broadsheet that is the FT
what does the chart say?
i'd venture it says this:
bear market is OVER
the bull snuck in undetected, like a ninja, under the radar form 03/09 to 04/11
when the retracement came in wave 2 it ended at precisely .618 of the rise
the psychology then was uber-bearish, typical of a wave 2 low following a major bear (GFC was, ahem, a major 'event', but it's over)
the beginning of the wave 3 up from the 03/09 low is quite possibly in play
400 point days are indicative of a wave 3 surge
good luck with it, and don't mind my musing inside the chart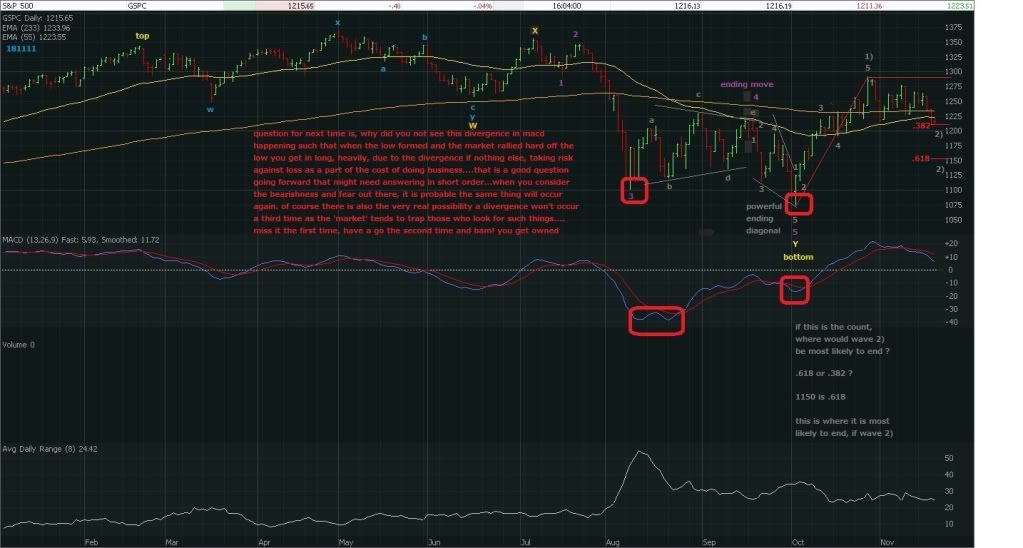
xjo weekend zoomba lounge, page-142


Add XJO (ASX) to my watchlist
 (20min delay) (20min delay)
|
|||||
|
Last
8,307.0 |
Change
54.200(0.66%) |
Mkt cap ! n/a | |||
| Open | High | Low |
| 8,252.8 | 8,307.2 | 8,252.8 |
| XJO (ASX) Chart |