But Funky, you should know that not all tops need signs of high volume distributing to happen
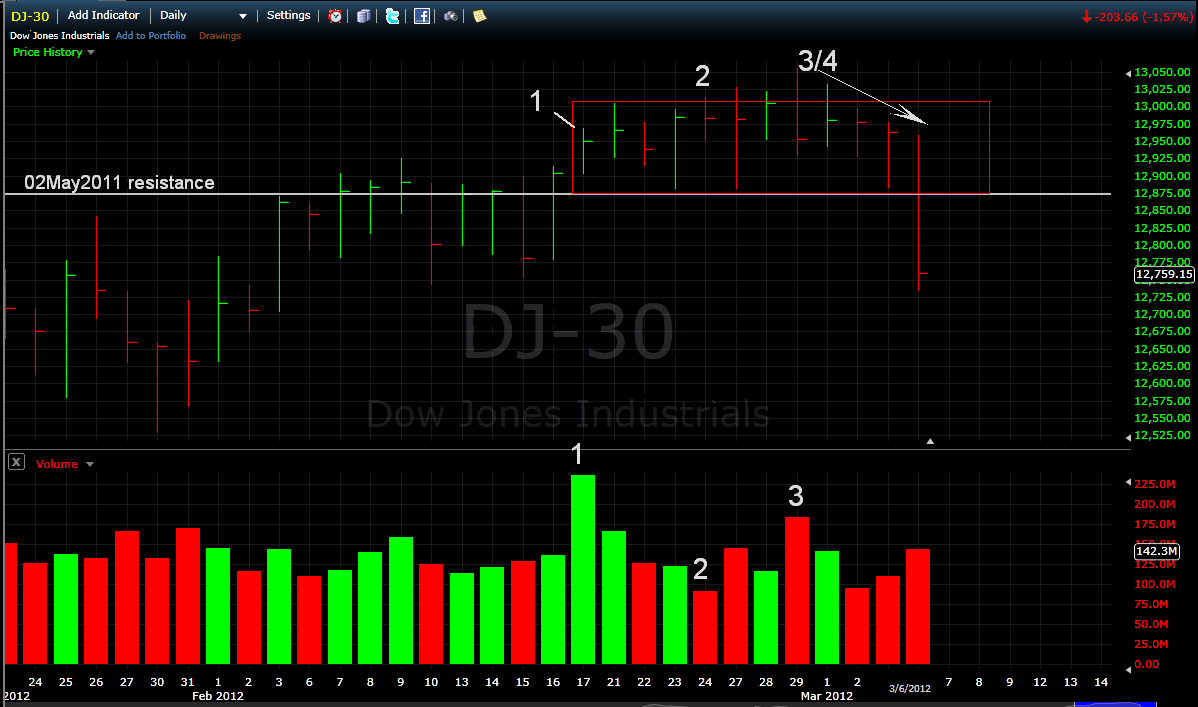
A closeup view of the daily DJIA with a tad of distributing.
got a small area of Distribution - at (1) we have a NARROW, much higher volume upbar, which is not really a great sign of strength, it should be of a wider spread, therefore in hindsight looking back there we now know it was the start of supply, also possibly supply in the next bar as well. Move along to (2) and it's showing a hint of 'no demand', which in combo with (1) possibly caused that following bar to have a much lower low. who knows. Now at (3/4) well they are not attractive both being a form of upthrusts (more supply), the first being on much higher volume and that is after making a higher high, catching more traders going long. From there it begins to or is allowed to break lower making lower highs lows and closes. Therefore if one looks at it a tad closer, instead of looking at say a multiple day bar chart, you could see that there was a chance of their last nights action unfolding. Also have to remember that this area we analysised was/is sitting in an old area of supply from way back of nearly a year, 05May2011 also had more than a third more volume than bar (1), how far do we retrace we'll see, might be all up and away next week, is it going to make GFC lows ha, we'll trade accordingly looking for signs of strength/testing and the norm any signs of weakness and NOT prempting (as Disco mentions) the silliness of forecasting the end of the world. Like if they are so sure WHY aren't they shorting, WHY ? cause they don't know if it is safe to with their money under the pillow doing nothing
- Forums
- ASX - By Stock
- XJO
- wasted wednesday
wasted wednesday, page-143
-
- There are more pages in this discussion • 35 more messages in this thread...
You’re viewing a single post only. To view the entire thread just sign in or Join Now (FREE)
Featured News
Add XJO (ASX) to my watchlist
 (20min delay) (20min delay)
|
|||||
|
Last
8,252.8 |
Change
38.300(0.47%) |
Mkt cap ! n/a | |||
| Open | High | Low |
| 8,214.5 | 8,271.8 | 8,214.5 |
Featured News
| XJO (ASX) Chart |
The Watchlist
I88
INFINI RESOURCES LIMITED
Charles Armstrong, Managing Director & CEO
Charles Armstrong
Managing Director & CEO
SPONSORED BY The Market Online


