Redbacka
March 2011 hey? Intertesting.....did you read the article I posted which belongs to the 2nd graph ob the VIX?
Excerpt:
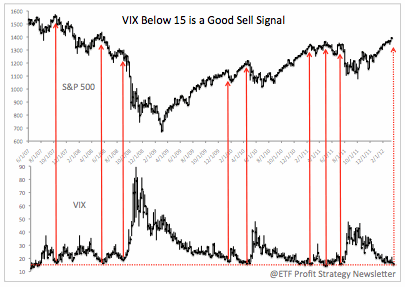
There are no absolutes at investing, but low VIX readings have proven to be a good sell signal. Since July 2007 the VIX dropped below 15 only twice - in April 2011 and a few days ago (Tuesday's low was 13.99, the April low was 14.30).
We know that last April's VIX low led to a swift 20% across the board decline, but to get a larger sample size, let's relax the parameter to VIX readings below or close to 15. This gives us a few more hits. The chart below plots the S&P 500 against the VIX.
The horizontal red line is drawn at the 15 level while the red arrows mark the corresponding S&P level. It doesn't take a Ph. D. in statistics to decipher the implications of a sub-15 VIX reading.
http://finance.yahoo.com/news/vix-near-5-low-jinx-163201735.html
- Forums
- ASX - By Stock
- XJO
- xjo weekend zoomba lounge
xjo weekend zoomba lounge, page-111
Featured News
Add XJO (ASX) to my watchlist
 (20min delay) (20min delay)
|
|||||
|
Last
8,295.1 |
Change
68.800(0.84%) |
Mkt cap ! n/a | |||
| Open | High | Low |
| 8,226.3 | 8,319.4 | 8,226.3 |
Featured News
| XJO (ASX) Chart |
The Watchlist
EQN
EQUINOX RESOURCES LIMITED.
Zac Komur, MD & CEO
Zac Komur
MD & CEO
SPONSORED BY The Market Online


