Here's an hourly chart of the last 18 trading days with comments included. I chose 18 days to highlight the volume trapped at prices that haven't been revisited since our recent run up to $1.125. This hopefully gives an indication of those who were shaken out in the run down to 86.5c but haven't had an opportunity to get back in yet at the price they bailed and this volume should provide some support.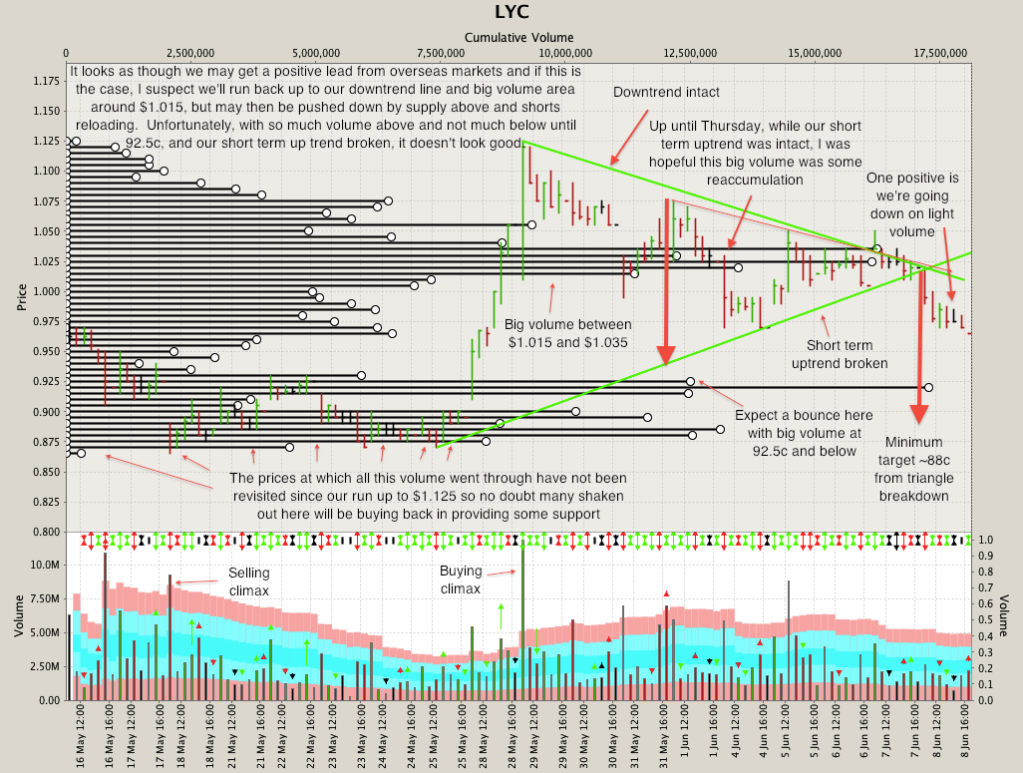


Add to My Watchlist
What is My Watchlist?
 (20min delay) (20min delay)
|
|||||
|
Last
$14.41 |
Change
0.130(0.91%) |
Mkt cap ! $14.30B | |||
| Open | High | Low | Value | Volume |
| $14.40 | $14.68 | $14.21 | $63.06M | 4.358M |
Buyers (Bids)
| No. | Vol. | Price($) |
|---|---|---|
| 1 | 816 | $14.39 |
Sellers (Offers)
| Price($) | Vol. | No. |
|---|---|---|
| $14.41 | 7853 | 1 |
View Market Depth
| Last trade - 16.19pm 12/09/2025 (20 minute delay) ? |
| LYC (ASX) Chart |