Hi all
Im sorry to hear of the disappointment - im not going to dwell on it too much. As we all know, we are responsible for our own trading.
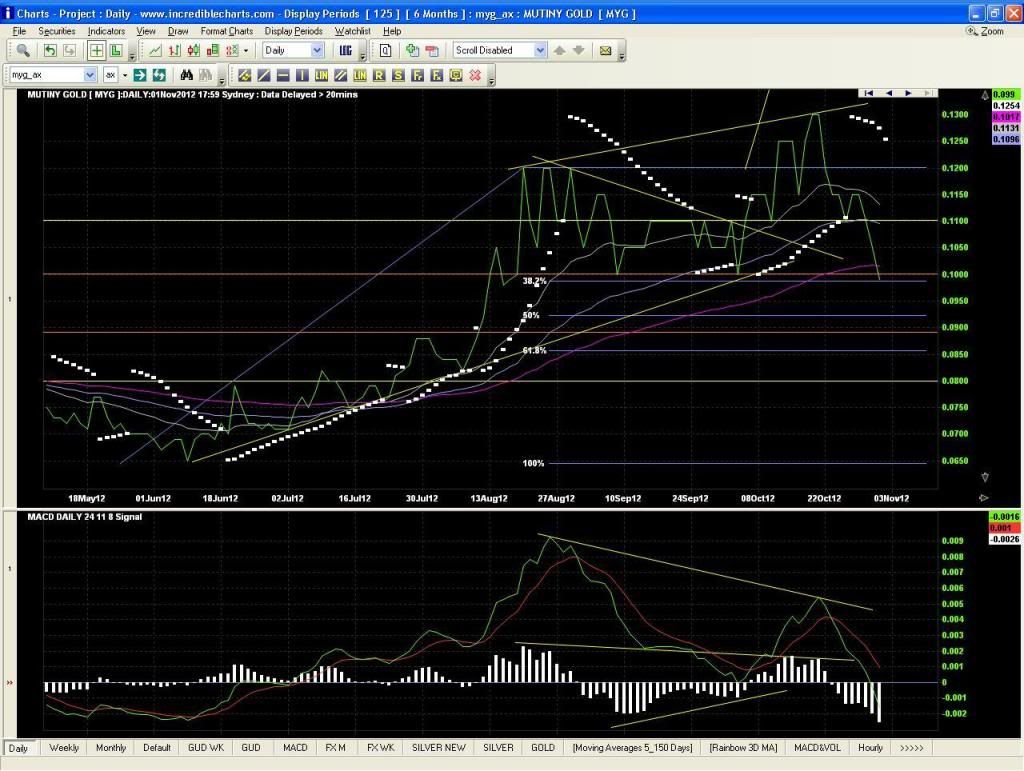
I will be honest. I sold my OA’s above 7c because I seen a bearish divergence on the chart.
I feel as many of you do, but being out Im not emotional at all about it.
Fundamentals aside for the purposes of this post.
I noticed this chart pattern and to be honest I sold against the better judgement of my emotions who wanted to hold on for the run to 20c and beyond – I really thought that was on the cards!! But the chartist in me wisely capitilised.
I sold because of a chart pattern you have to have balls of SOLID STEEL to ignore.
Note below the PRICE made higher highs and yet the oscillators made LOWER HIGHS. DO NOT IGNORE THESE SIGNS. They are a GIFT!!!
As soon as I seen the formation solidifying I sold those OA’s.
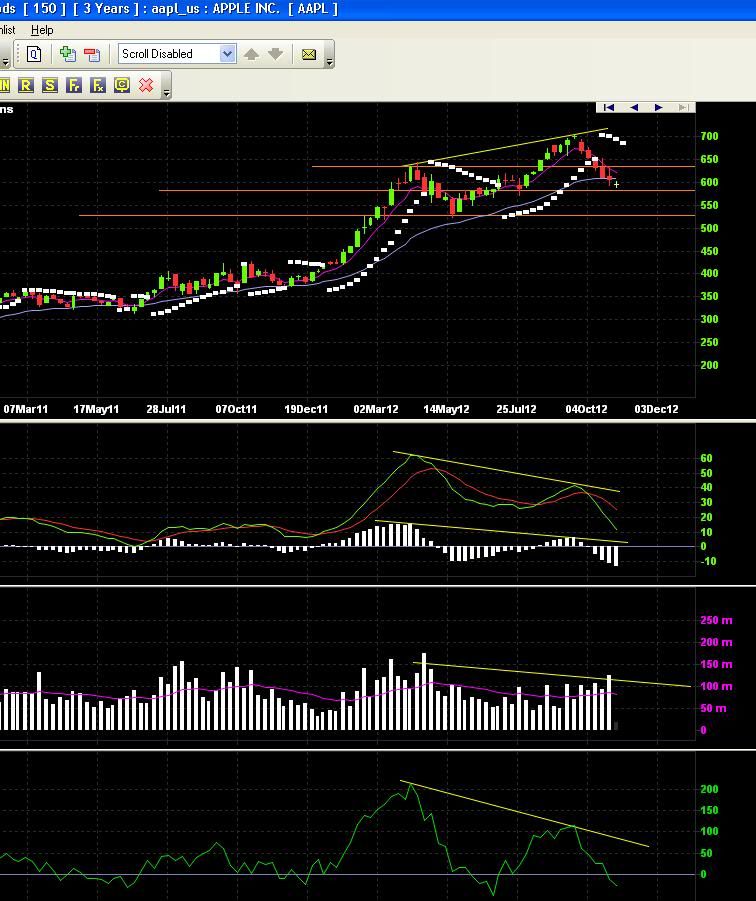
I have been calling a short on APPL for weeks because of the EXACT SAME FORMATION. A bearish divergence – on a much larger scale though as apple is the power player of the NASDAQ.
My point is, I hope you recuperate you dosh, I really hope you will. Look for these signals. Its all there. Also the bullish signals are there too, opposite and inverse (if you don’t know what that means, go back to texas hold’em).
I really hope MYG holders can make a buck or two from this strategy to make up for this management blunder/disaster. I still think the project has legs but in what decade, Im not sure. THE CHARTS NEVER LIE. Keep it under your hat!
I feel obliged to let the cat out because I made damn good profits.
Cheers
riskninja
- Forums
- ASX - By Stock
- MYG
- divergences..capitalise on them
MYG
mayfield group holdings limited
Add to My Watchlist
4.76%
 !
$1.40
divergences..capitalise on them
Featured News
Add to My Watchlist
What is My Watchlist?
A personalised tool to help users track selected stocks. Delivering real-time notifications on price updates, announcements, and performance stats on each to help make informed investment decisions.
 (20min delay) (20min delay)
|
|||||
|
Last
$1.40 |
Change
-0.070(4.76%) |
Mkt cap ! $133.2M | |||
| Open | High | Low | Value | Volume |
| $1.39 | $1.44 | $1.39 | $36.01K | 25.79K |
Buyers (Bids)
| No. | Vol. | Price($) |
|---|---|---|
| 1 | 967 | $1.40 |
Sellers (Offers)
| Price($) | Vol. | No. |
|---|---|---|
| $1.49 | 8600 | 1 |
View Market Depth
| No. | Vol. | Price($) |
|---|---|---|
| 1 | 967 | 1.400 |
| 2 | 6947 | 1.390 |
| 1 | 3000 | 1.360 |
| 1 | 400 | 1.350 |
| 1 | 10000 | 1.340 |
| Price($) | Vol. | No. |
|---|---|---|
| 1.490 | 8600 | 1 |
| 1.500 | 44047 | 2 |
| 1.550 | 5534 | 1 |
| 1.560 | 5000 | 1 |
| 1.700 | 53549 | 2 |
| Last trade - 15.47pm 19/09/2025 (20 minute delay) ? |
Featured News
| MYG (ASX) Chart |


