no sunnyskies, waiting for HL
day chart
lol reaperman
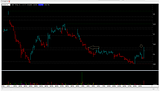
60min chart ... which clearly shows the huge volume that came in after the announcement .. is it good or bad ie. is it absorption .. or is it the regular supply
1. "absorption.." note how the high of the bar takes out that previous intraday resistance level, did it take out all the shorts that were sitting there, it has unfortunately closed off its high, but if it is to be absorption, you'd want to see, either, the shareprice to nic off higher immediately OR show testing within the spread of THAT bar, and then move higher, easy hey
2. "supply.." we all know what and how the pro money hide their selling/offloading, and thats within high volume UPBARS, and thats exactly what we have here, no ifs or buts.. If it is supply, watch out for further signs of weakness (on this timeframe) ie. no demand, upthrusts, high volume narrow upbars etc
2weeks til xmas, page-48


Add LYC (ASX) to my watchlist
 (20min delay) (20min delay)
|
|||||
|
Last
$7.75 |
Change
0.030(0.39%) |
Mkt cap ! $7.244B | |||
| Open | High | Low | Value | Volume |
| $7.71 | $7.81 | $7.63 | $12.03M | 1.561M |
Buyers (Bids)
| No. | Vol. | Price($) |
|---|---|---|
| 1 | 6556 | $7.73 |
Sellers (Offers)
| Price($) | Vol. | No. |
|---|---|---|
| $7.77 | 3385 | 1 |
View Market Depth
| Last trade - 16.10pm 11/10/2024 (20 minute delay) ? |
| LYC (ASX) Chart |