OK todays chart,
First thing is - a strong close on good volume, bollinger bands opening heading north, MA bullish cross over confirmed today, I added two vertical lines 15oct and today, showing levels on RSI graph to show that there is room to run up to the .14c level before entering overbought territory. I do like that there has been a good consolidation period from mid December, and today appears to be a strong break from the 2 month period.
Tomorrow will be telling who has control ie: a close above .11c without breaking .105 will give it to the bulls.
In coming days.14c will offer resistance (should we get there). Time will tell how far a pull back could be, though I for one will be happy to see the back of single digits.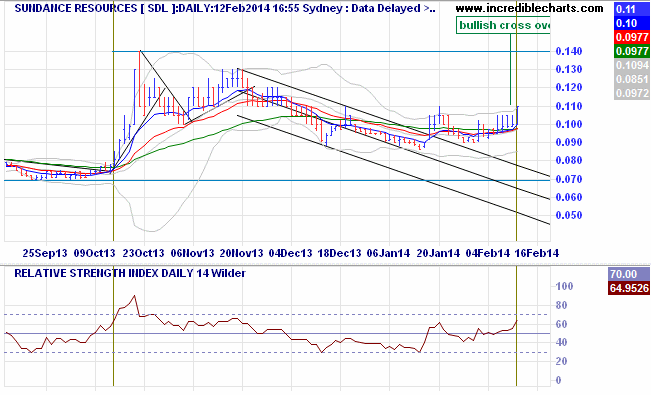


Add to My Watchlist
What is My Watchlist?