With all due respect, so far charts proved to be useless. As Rene .Rivkin said, they are good for one thing only, to show us where the SP been, not for where it is going.
MKT The ASX can overlook its Telecomm small-caps. Here’s one diversified brand with an international footprint
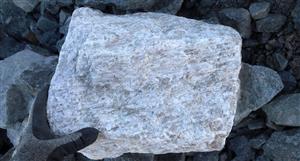
TG6 Lake Johnston pegmatite responds well to simple DMS processing for TG Metals, yielding 6.31% Li2O spodumene