@Vulture @mitta
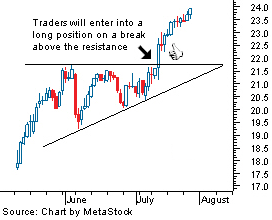
What do you think ascending triangle perhaps in need of more time to confirm looks very much like it as per the pic explanation?
Ascending Triangle
The ascending triangle is a bullish pattern, which gives an indication that the price of the security is headed higher upon completion. The pattern is formed by two trendlines: a flat trendline being a point of resistance and an ascending trendline acting as a price support.
The price of the security moves between these trendlines until it eventually breaks out to the upside. This pattern will typically be preceded by an upward trend, which makes it a continuation pattern; however, it can be found during a downtrend.
Column 1 0 1 Figure 2: Ascending triangle
As seen above, the price moves to a high that faces resistance leading to a sell-off to a low. This follows another move higher, which tests the previous level of resistance. Upon failing to move past this level of resistance, the security again sells off - but to a higher low. This continues until the price moves above the level of resistance or the pattern fails.
The most telling part of this pattern is the ascending support line, which gives an indication that sellers are starting to leave the security. After the sellers are knocked out of the market, the buyers can take the price past the resistance level and resume the upward trend.
The pattern is complete upon breakout above the resistance level, but it can fall below the support line (thus breaking the pattern), so be careful when entering prior to breakout.
TA, page-11
-
- There are more pages in this discussion • 520 more messages in this thread...
You’re viewing a single post only. To view the entire thread just sign in or Join Now (FREE)
Featured News
Add AJX (ASX) to my watchlist
 (20min delay) (20min delay)
|
|||||
|
Last
1.0¢ |
Change
-0.001(9.09%) |
Mkt cap ! $15.73M | |||
| Open | High | Low | Value | Volume |
| 1.1¢ | 1.2¢ | 1.0¢ | $4.212K | 408.3K |
Buyers (Bids)
| No. | Vol. | Price($) |
|---|---|---|
| 3 | 3043885 | 1.0¢ |
Sellers (Offers)
| Price($) | Vol. | No. |
|---|---|---|
| 1.1¢ | 450000 | 1 |
View Market Depth
| No. | Vol. | Price($) |
|---|---|---|
| 3 | 3043885 | 0.010 |
| 4 | 352963 | 0.009 |
| 2 | 510000 | 0.008 |
| 2 | 240000 | 0.007 |
| 3 | 516888 | 0.006 |
| Price($) | Vol. | No. |
|---|---|---|
| 0.011 | 450000 | 1 |
| 0.012 | 714 | 1 |
| 0.014 | 137511 | 2 |
| 0.015 | 129929 | 2 |
| 0.016 | 5328505 | 2 |
| Last trade - 16.10pm 08/11/2024 (20 minute delay) ? |
Featured News
| AJX (ASX) Chart |
The Watchlist
EQN
EQUINOX RESOURCES LIMITED.
Zac Komur, MD & CEO
Zac Komur
MD & CEO
SPONSORED BY The Market Online


