China is showing strong growth across all copper consuming sectors.
Global copper inventories are moving to Shanghai, with SHFE inventories exceeding LME inventories for the first time since 2004.
Significant infrastructure plans from China and India could result in a demand spike within 12 months.
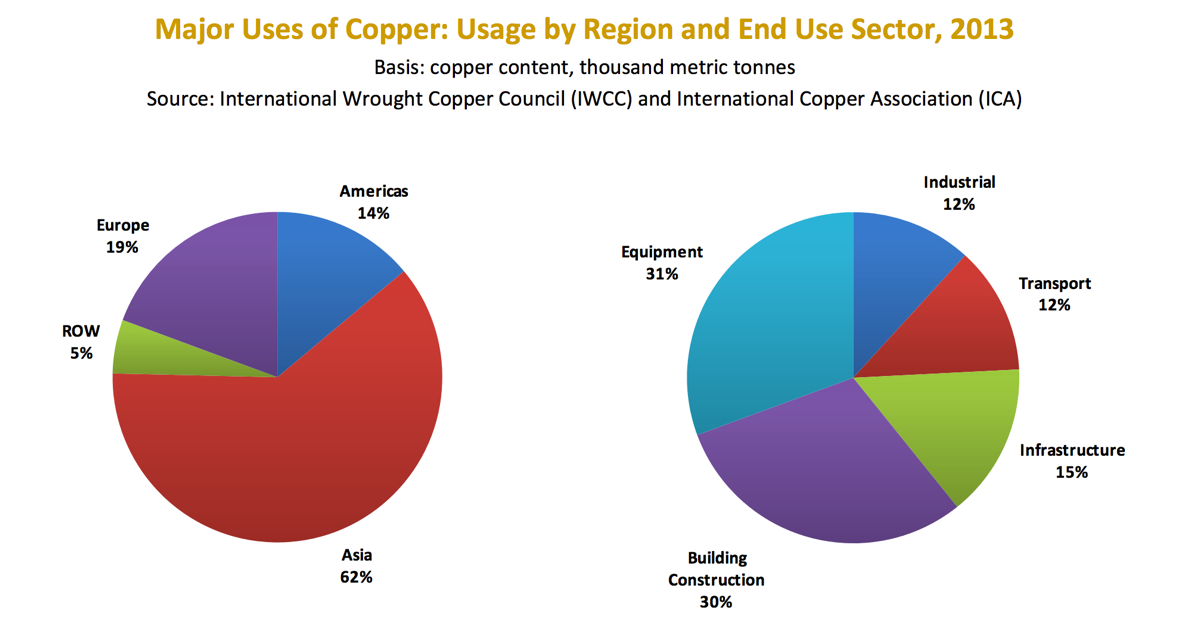
As mining stocks continue to advance in the wake of rising commodity prices, investors have noticed the growth of bullish news articles. I don't take much stock of most commodity news articles, but as prices turn there are plenty of reasons to be bullish for commodities. As commodities fell in lockstep, it did not seem to matter where the fundamentals lay. At the end of the day, copper is one of the most valuable materials for a modern society. It occupies nearly every electronic device you can find, transport, power, goes into building construction, and has dozens of other uses.
Source:ICSG
This article is the second part of a series on copper supply, demand, and prices. For those who have not read the first article, you can find it here. If you don't have the time to catch up, the outcome of sifting through country-by-country supply data saw nearly every copper producing country reducing output, except for Peru. We had some excellent commentary on the article, and one reader provided some great insight into falling grades, regulatory failures, water constraints, and power outages.
Copper is not synchronized with iron ore. It is rare, difficult to produce, and the current pricing environment is leading to significant restraint on rising copper supplies. As prices start to increase amongst a sharp drop in London's Mental Exchange (LME) warehouse stocks, we could be seeing proof that copper demand remains high.
So where do we start with demand? China. With renewed vigor to the calls that China is increasing stimulus packages, calls from CEO's that demand remains high for copper, and analysts starting to call for a supply deficit rather than surplus, copper has increased nearly 30% from its lows in January. However, as one Reuters article puts it, this may just be a shuffling exercise between exchanges, as Shanghai's stocks have risen in the face of falling LME inventories. The last time Shanghai's inventories exceeded LME stocks was in 2005, just before copper prices moved into an extended bull market.
As Andy Homes points out, copper movement shifting to China is broadly going into storage. This could mean a few things, but it is due in large part to arbitrage, where the LME is in contango, and Shanghai Futures Exchange (SHFE) is in backwardation. One wonders whether the storage is building up to take advantage of low prices on higher expected future demand? Time will tell.
Copper consumption is difficult to separate from purchases in the short term, so we can't directly use warehousing as a proxy for consumption. There is a large grey market for copper storage in China, and the government has stockpiles that arguably exceed those on the SHFE. Bears point to the usage of Copper as store of value as a means of non-consumption driven demand. To get an accurate gauge of whether China's consumption is growing relative to previous years, I'll head to the consuming sectors: Construction, transportation, electrical grid, electronics and industrial machinery. Construction
First up, construction contracts, a sector which makes up approximately 31% of copper consumption has been steadily growing for the last ten years. I take Chinese data with a grain of salt, specifically when it comes to construction firms, but this appears to corroborate the story of growing demand.
Transportation
Auto sales have been growing in China, with growth reported at 9%, numbers that are expected to continue due to a recent tax cut on small vehicles. While double digit growth rates seem to be a thing of the past in China, the absolute number relative to growth is large, and expected to grow even faster as China moves into summer. Ford alone saw growth of 36% month-on-month in the Chinese segment, a fact that could result in significant copper consumption by the industry. For reference, each car uses 20-30 kg's of copper per vehicle. If car purchases increase in China by 0.5 mn cars per month, it results in an incremental copper consumption of 10-15 kilo-tonnes per month, or 0.12-0.18 mn tonnes per year, above current levels. The equivalent of several small copper mines.
Electricity Grid
There is no doubt that a large chunk of copper consumption goes toward power transmission in the form of wires and transformers. As China continues to industrialize, its appetite for power, as a proxy for copper, is rising as well. With a recently proposed spending budget of $2 tn Yuan ($US 315 bn at the time of the referenced article) to improve its energy infrastructure, China will continue to absorb copper into its grid. Nearly half of all China's copper consumption goes towards grid infrastructure, and China has recently been discussing abandoning aluminum wiring in favor of more expensive, but reliable, copper wire. The outcome of which could drastically effect the demand for copper over the short term.
"He did not give an estimate for copper consumption under the proposal, but said more than 1 million tonnes of copper had been used in power transmission projects in 2014 when the investment was about 170 billion yuan" - Reuter's quoting an analyst at Antaike, a state backed research firm.
Averaged over the next five years, we would expect to see an increase in copper consumption by the sector of 100%, an increase of more than 1 million tonnes per annum (mmtpa) compared to 2014 levels. Furthermore, other sources prescribe much higher numbers to the sector, with the International Copper Association estimating that approximately three mmtpa are used in grid infrastructure. Perhaps the large purchases by government-backed warehousing is a response to both low prices and expected demand rather than more nefarious possibilities proposed by some speculators. If we saddle this growth with a movement to more copper-based infrastructure, growth could well exceed 150% by the sector. Electronics
China's electrical and mechanical exports have been growing in all but the most recent year. However, over that same period the USD has strengthened 8% over the Yuan, depreciating the value of exports in USD terms.
It would appear that the myth of cratering export in China has bene overdone. If we control for the depreciation of the Yuan, Chinese exports have increased in dollar terms. While this isn't stellar growth, it also doesn't take into account the more difficult to account internal consumption which has inevitably been growing with the wealth of its middle class. Sector Wrap-Up
Of the main areas that make up China's copper consumption, the only sector that is not expected to grow at a significant rate this year are electronics. The construction industry is ramping up, electrical grid investment is ramping up, and the automotive industry is growing at a rapid pace. To be sure, plenty of this data is put out by Chinese governments and may not necessarily be the absolute truth, but the external data we have about the country seems to corroborate the story being told by national statistics. Chinese domestic consumption looks to rise a minimum of 1.2 mmtpa in 2016, and up to 3.5 mmtpa over the next five years, well in excess of the oncoming supply from Peru.
With China's copper consumption set to grow more each year, the country has set out on securing it's needs. This has not happened just in copper, but in food, oil and gas, and other commodities that China needs in abundance. While the government's recent follies have had many investors questioning their competence, the fact remains that it has a history of forecasting its needs, and ensuring that the country has the capacity available to feed its growth engine. Demand Outside of China
World demand has grown consistently over the past 100 years while both population and copper usage person have increased in lockstep. Many rich world countries, including theU.S.A, and Japan exceed copper usage of 10 kg/person, and Korea exceeded 14 kg/person during its growth years. China is currently consuming around 5.4kg/person while India consumes 0.4 kg/person. If incomes for India's 1.2 bn people start to rise, we can expect to see a rapid increase in copper consumption, leading to the next wave of demand. Vedanta, an Indian owned commodity producer, predicts Indian copper consumption to grow at 7% per year as infrastructure spending is increased. If Narendra Modi, India's Prime Minister, is successful in his push to revive foreign investment and infrastructure spending, growth could easily exceed the 7% target. Investors should be watching for the outcome of India's land acquisition bill, which would signal the start of a potential bull market in India's infrastructure spending.
Copper demand is growing across the entire world, some western economies have seen decreasing demand as wealth has peaked, but this is more than offset by the rise of demand in Asia and South America. Germany continues to export record amounts of copper products, and we can expect these trends to continue as the global middle class continues to grow.
Wrap-Up
When we look at the entire global picture, it is quite clear that copper demand will continue to rise. Across every sector, China is seeing growth, and the copper-dependent automotive industry is booming ahead as China's middle class grows. Both India and China are set to ramp up infrastructure spending, which would sharply increase copper demand, and investors should be watching for the outcome of the Aluminum vs. Copper debate in China, and the result of India's Land Acquisition Bill as a signal for a steep rise in short term copper demand. Copper prices have risen nearly 30% over the past few weeks and appears to have little sign of slowing. This could be a short term hiccup or the accelerated timing of a supply surplus moving to a supply deficit. The bears seem to be losing strength in their speculation on copper, and the data is pointing toward rising prices.
I always believe that the simple explanation is often the most accurate, and while the copper market is all but simple, these facts are: Supply Side
All the main copper producing countries except Peru are decreasing production.
Average copper head grades have been declining consistently, a continuation of long-term trends dating back 30 years
Cost of production has been rising, and the energy input required to mine copper has been rising
Layoffs across the sector and decreased capital expenditure forecast even more limited supply outside of Peru
Increasing water and electrical shortages will result in more unplanned outages and shutdowns
Demand Side
Copper is not readily substituted for any other material
China and India have significant growth projections for copper demand in the near term while China has seen copper consumption grow in nearly every consuming sector
A substantial amount of copper is moving to China from the LME
A softening U.S. dollar will make commodities prices rise
Far from copper over supply, it appears we are headed for a deficit. The current rise in the copper price may be countered in the short term, but the long term trend is clear. Copper prices will need to increase to justify the supplies required to meet worldwide demand. My view is that copper has now bottomed, and if it does revert, it will only be short term in nature. It will not be long (12-24 months) before copper begins to rise sharply. How high it will go is hard to predict, but many companies will be returning great yields with a copper price of $US 3.00/lb based on their current valuations, a number that will be exceeded in the event of a copper deficit.
MAH will get More mining services Contracts ..
MAH Price at posting:
12.0¢ Sentiment: Buy Disclosure: Held


 (20min delay)