Yes I preferred strength with a break of 8.6 on chart today for a more pleasant setup next week. But all is not lost providing the high 6's remains put (+/- 6.8?), which is also possible. (GL)
Seems to be in a short term downtrend atm. Maximum support shouldn't exceed 6.5 for Monday (being on the extreme side) with max resistance on 8.6 methinks..
But hopefully the possibility of the sturdiness of high 6's comes good fingers crossed.
Couple of indicators are pointing to oversold on the short term chart while they're overbought on the medium term. So don't know if it remains in short term oversold territory longer till medium term catches up or it crosses soon to issue a buy indication. (the latter be fine)
Don't favor posting charts as all of my opinions are derived from them anyway but here's the daily one without all the frills anyhow. Prefer to keep them simple. Cheers
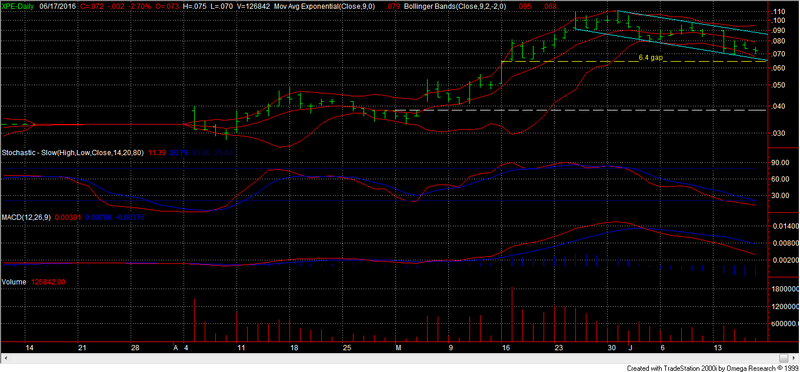
XPE Charts, page-5222


Add OAK (ASX) to my watchlist
 (20min delay) (20min delay)
|
|||||
|
Last
6.9¢ |
Change
0.000(0.00%) |
Mkt cap ! $1.862M | |||
| Open | High | Low | Value | Volume |
| 0.0¢ | 0.0¢ | 0.0¢ | $0 | 0 |
Buyers (Bids)
| No. | Vol. | Price($) |
|---|---|---|
| 2 | 91166 | 6.9¢ |
Sellers (Offers)
| Price($) | Vol. | No. |
|---|---|---|
| 8.5¢ | 182500 | 1 |
View Market Depth
| Last trade - 16.12pm 12/07/2024 (20 minute delay) ? |
| OAK (ASX) Chart |
Day chart unavailable