Right now I am not sure I want to give prices because without a reference point it is a little misleading. So for now I will just be general.
For third week in a row La and Ce have been flat in china and US. 45% % REO has only been flat for a week. Not sure what it means but low grade stuff seems to be holding up better than high grade.
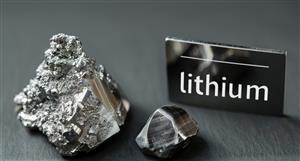
NdPr has been flat for a week. It is still doing much better than Nd or Pr
Nd Oxide has been flat for several months. It is still below May, June, August, and September prices. What is interesting is EU price for Nd metal and Nd oxide continues to fall in EU. I have not found any articles for why EU is out of sync. One of the biggest non Chinese Magnetic materials processing plants is in England it use to belong to GWM. For now I am just saying this is caused by the pound's and EU's behavior since BreExit. Will not mention it again unless I see something I think is important. I am not following this plant at all, I assume it is still commissioned, they did major upgrades a few years ago. (2013?)
Pr has been virtually flat since August and is Still lower than its Q4 average prices. 99.5% OXIDE did have a blip down in, China only, early August and it is higher than that blip but everything else is still lower than any price since early June.
I have not seen a post by the person that claims to publish both up and down prices from Asians metals. Most prices are down. this is not inconsistent with my saying they are flat. There were some small price rises in august and bigger ones 30 days ago. Recent flat prices when compared to positive price rises 30 and 90 days ago will show small negatives if not filtered. AM does not appear to do any filtering.
I would like to give more info from but want to keep it simple. Would appreciate comments of what people want to see.
I am also debating period 1 week is shortest I will do maybe 2 weeks or month is better?
Asian Metal RE prices up again, page-70


Add LYC (ASX) to my watchlist
 (20min delay) (20min delay)
|
|||||
|
Last
$7.72 |
Change
0.000(0.00%) |
Mkt cap ! $7.216B | |||
| Open | High | Low | Value | Volume |
| 0.0¢ | 0.0¢ | 0.0¢ | $0 | 0 |
Buyers (Bids)
| No. | Vol. | Price($) |
|---|---|---|
| 1 | 90575 | $8.24 |
Sellers (Offers)
| Price($) | Vol. | No. |
|---|---|---|
| $7.00 | 4500 | 1 |
View Market Depth
| Last trade - 09.55am 17/10/2024 (20 minute delay) ? |
| LYC (ASX) Chart |
Day chart unavailable