Microcap.co | Jan. 16, 2017, 11:18 AM | 1,373 | 1 24hgold but you have to pay to view more than 3 searches. Another tool that’s free is simply googling “gold mining feasibility study” and limit search results to the last 6 months.)
Here’s what you need:
Technical Report
Valuation Model – (Scroll to the bottom to download gold mine valuation model for free.)
Company Website
1. Technical Report Mine Status
Every mine that goes into production has a technical report written by geologists and engineers. This report is called “NI 43-101”. They can be found on the company’s website or in the SEDAR database for a Canadian mining company or on SEC EDGAR for a US mining company. The first page of the technical report will tell you the type of report, which basically means the stage of the mine. These stages are:
PEA (Preliminary Economic Assessment)
Pre-Feasibility Study
Feasibility Study
A PEA is a very early stage report that defines the resources but that is pretty much it. The probability of a mine with a PEA eventually going into production is very low (i.e. just because a mine has a PEA, it does not mean it’s sure to become a mine). The next progression after a PEA is a pre-feasibility study, which has a 10%-30% chance of the mine going into production down the road. It defines the resources with more confidence and discusses the possible economics of the mine (i.e. how much capital costs might go into developing the mine, which is determined by the annual production capacity that makes sense for this particular mine, etc.). The next step after a pre-feasibility study is a feasibility study, which is the most advanced stage of the mine before construction and development begins. It is a more detailed report than the pre-feasibility study with a higher certainty of its assumptions being met. Aside from the majority of the report being a technical assessment, it is essentially a detailed business plan.
By the way, each stage takes years. After a PEA is issued, most likely it will take 2-3 years before a pre-feasibility study and then another 1.5-2 years for a feasibility study. Then anywhere from 1year-never for the permitting process. And finally once you have all the ducks in a row, another 2-3 years for construction and development. In other words, it takes anywhere from 6-10 years before a mine starts producing from the time a PEA is issued. (Note that there is a variance to this time frame depending on many factors. Most notably, a smaller mine in an already mining prolific town where it is easy to get permitting may shave off a couple of years or a big, complicated mine in a politically unstable environment or where there are indigenous protests, may take north of 10 years.)
So, let’s say we settle on a mine that has a feasibility study. As an example, we’ll look at Avnel Gold and its Kalana Gold Project.
What to Extract from a Technical Report
As I said before, there is a lot of technical jargon to understand in mining. And a technical report can be hundreds of pages long. But from my many years of valuing mining companies, you just need to extract the necessary info to value a mine. (Of course, the more of a technical expert you are, the more you can understand the viability of the mine, but most of us aren’t going back to school to get a geology or engineering degree, I don’t think.) So, what to extract from a technical report:
Mine Start Year
A feasibility is usually optimistic in the permitting process, the length of time for construction and development phase and the pre-production phase. So, I would add 1-2 years to the mine start year that the feasibility study lays out. If the company has already made significant plans to develop the mine after the feasibility study has been issued, you can often find in their annual or quarterly reports or press releases when they expect production to start. *Note that before full capacity production, the company tests the processing and optimizes the plant. This phase is pre-production and the very first gold produced is called a “gold pour”. We are looking for the year in which “commercial production” starts.
In the Kalana Mine feasibility study, the anticipated commercial production start year is July 2018.
It is highly unlikely for a mine to start producing on time. So, I am going to tack on 1.5 years and say that full capacity commercial production starts in January 2020.
2. Reserves & Resources
By the time a feasibility study is written on a mine, the resources are reported with a high degree of certainty. These are called Proven & Probable Reserves. Each category of reserves or resources tells you the degree of certainty that the stated minerals are indeed there and mineable. If you’re trying to value a mine that only has a PEA, you may only see Inferred Resources. This is kind of a stick your finger in the air and guess how much mineral might be contained in the ore. Well, maybe a little more certain than that. The general rule-of-thumb in converting each category of stated reserves & resources into mineable minerals is:
What this means is, looking at Avnel Gold’s Kalana Mine example, its feasibility study has proven & probable reserves of 1.96 million ounces (or “oz”):
In my valuation model, I’m going to cap the number of ounces produced by the mine at 90% of 1.96 million ounces or 90% of 21.7 million tonnes which is 19.5Mt. Note the grade of 2.8g/t of gold (“Au”) in the table. We’re going to use this number below.
Note that “Tonnes” is the ore (or the actual raw rock) that is mined and processed, “Grade” is how much gold is contained in the ore, and the “Ounces” is the resulting number of gold in ounces. The formula is very simple. It helps us figure out the production rate (discussed in the next section):
*Note: tonnes, not tons. And Troy ounces, not imperial ounces.
3. Annual Production Run Rate
Under the Economic Analysis section, the feasibility study will lay out the plant throughput. The plant throughput is how much ore (the raw rock) is mined and processed to extract the gold. This is where the “grade” calculation from above is used. In the Kalana Mine feasibility study, the plant throughput rate is 1.5 million tonnes per annum:
Putting together the reserves estimate from above and the annual throughput rate, we model in our valuation 1.5Mtpa per year until we reach a cap of 19.5Mt. That is for 13 years (19.5 / 1.5).
And to convert the 1.5Mt of ore processed each year, using the formula stated above, we multiply it by the grade of 2.8g/t from the reserves table above. That will give us 4.2 million grams. Gold is expressed in troy ounces, so 4.2 million grams is then divided by 31.1035 to result in 135k ounces.
Plopping this into our valuation model with the start year of 2020, this is what it looks like so far:
— At this point, it might be a good idea to scroll to the bottom of this page to download the valuation model for free so you can follow along. —
4. Gold Recovery
Once gold is extracted through the plant at the gold grade, the gold gets further processed to become refined. The Kalana Mine feasibility study states that the Life of Mine (LOM) gold recovery rate is 92.7%, which is extremely optimistic. But for the purpose of this valuation, we will use this number (and because we can always change this assumption later). We simply multiply this to the gold produced to get the refined, recovered gold of 125.2k ounces per year.
5. Operating Costs
The main categories of operating costs are (1) mining, (2) processing, and (3) G&A.
(1) Mining cost consists of all costs associated with excavating the ore (e.g. mine equipment operator cost, fuel cost, maintenance cost, explosives cost, etc.). Expressed as US$ per ounce of gold produced.
(2) Processing cost includes costs associated with the plant, where the ore is processed into gold (e.g. equipment maintenance, plant labor including plant engineers, water treatment, lease, power and utilities, etc.). Expressed as US$ per tonne processed.
(3) G&A cost is comprised of salaries in corporate office, HR, security, environmental costs, land patent tax, etc. Expressed as US$ per ounce of gold produced.
The feasibility study details out the operating costs and also group them which is convenient for the valuation model.
Important to note is that in mining, operating costs are stated as cost per ounce of gold produced. This is for 2 primary reasons: (1) to be able to compare among other gold companies in the industry, and (2) since the gold price is an important economic indicator for the economy in general and for mining specifically, one can easily assess the viability of a mine by netting the gold price by the operating cost, which are both stated in per ounce.
In the Kalana feasibility study, these costs are estimated to be:
– Mining cost: US$380.3/oz
– Processing cost*: $17.68/tonne
– G&A cost: US$74/oz
*Watch out for processing cost expressed as tonne thus calculation is a bit different than the other. See valuation model.
Sometimes, mines have a royalty obligation, which is common when a land owner sells the property to a mining company. The most common type of royalty is Net Smelter Royalty (“NSR”), which is a percentage of recovered gold. At this mine, there is a 3.0% NSR royalty. So we have to account for that.
The government could also collect a royalty – in this case, there is a 0.6% stamp duty on gold sales.
6. Capital Costs (aka Capex)
Are you still with me? We don’t have much to go. Stay with me. It’ll be so worth it. You’ll know how to value any gold mine!
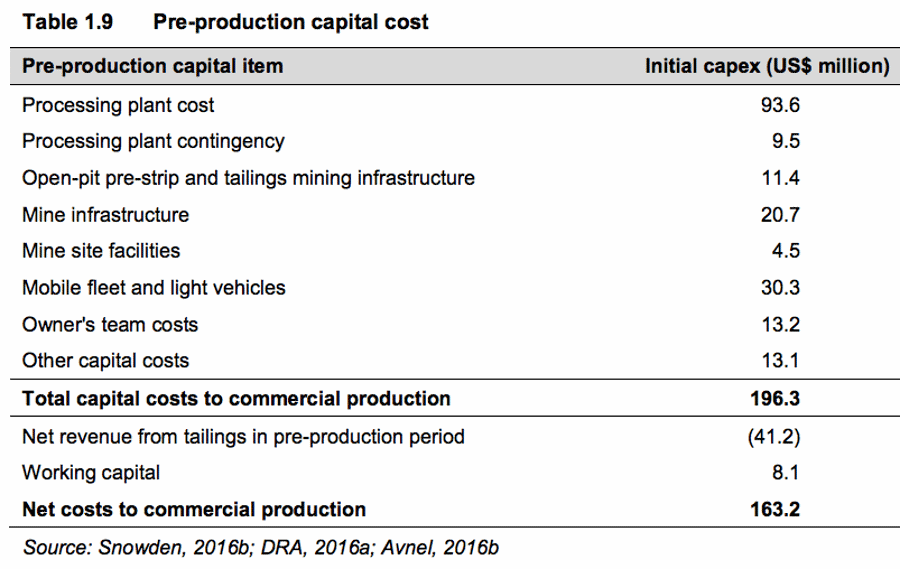
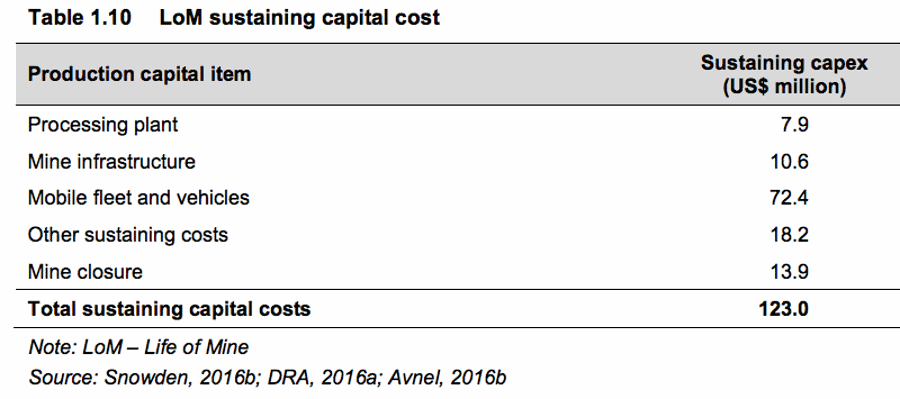
Capital costs are categorized into (1) initial capex and (2) sustaining capex. They are what they sound like. Initial capex consists of construction and development of the mine. All the costs before the plant is producing gold. Sustaining capex is cost associated with maintaining or upgrading all the equipment and assets throughout the life of the mine.
Kalana Mine’s total initial capex (aka pre-production capital cost) is $196.3m.
The total sustaining capex is $123m. Of this total, $13.9m is mine closure cost.
Also provided in the feasibility is a schedule of how the costs are allocated throughout the mine period. However, many companies spread out the initial capex for the sake of the economic valuation. For example, mining fleets are expected to be purchased close to the end of the mine period, which makes no sense but helps the mine be valued higher. So, a rule of thumb is to use the total life-of-mine capex estimates and allocate accordingly:
Initial capex: 35% in Year -2 (i.e. 2 years before production), 50% in Year -1, and 15% in Year 1. So, if the mine start year assumption is 2020, $196.3m is allocated as such: $68.7m in 2018, $98.2m in 2019, and $29.4m in 2020.
Sustaining capex: $13.9m mine closure cost will be assumed in the last year, so backing this out, the remaining $109.1m sustaining capex will be allocated among the 13 year mine period, which is $8.4m per year.
This way of calculating is obviously a much simplified version. However, when the discounted cash flow goes out 20+ years, the sustaining capex smooths out to be similar and as for initial capex, having the cost be borne upfront is a more conservative approach so any upside beyond the valuation from this approach is a nice present.
You did it. We have finally reached the end of all the info you need from the technical report to value a gold mine. Out of the ~350 page report, you just need the above 6 data. Not so bad, right?
Now on to the fun stuff (Follow along and download the valuation model for free at the bottom to try it on your own with any gold mine).
2. Valuation Model
As you read through the above, we’ve already been going through how to take the info that you extract from the report and put them into the valuation model. So, you should already be somewhat familiar with the flow of the valuation model so far (and once you download it for free at the bottom, you can try it for yourself and use it to value other gold mines).
A typical microcap mining company (~$100m) has one mine that they are working on (either to bring it to production or they are producing it. But we’re not interested in the already-producing ones because there’s less upside). In other words, they are a single-asset company. As such, the value of the mine minus any liabilities is equal to the value of the company, otherwise known as Net Asset Value (“NAV”).
Because a mine’s economics is a set of cash flows in and out during a defined period of time, the best valuation approach to use is the Discounted Cash Flow (“DCF”), which the valuation model in this example uses. Adding up all of the discounted cash flows, we will derive the Net Present Value (“NPV”).
If you haven’t already, I strongly encourage you to scroll to the bottom and download the valuation model as it will be a lot easier to see what’s happening in the model as you read the steps.
VALUATION DATE
First, at the top of the model, enter the valuation date that you want to calculate the NPV on. It could be a future date if you want to know what the valuation will be at a future date.
If you are using the model in 2018 or 2019, then you can change the years by changing where “2017” currently is.
If you’ve noticed by now, all of the LIGHT BLUE font means you can change the assumptions and input it directly. Black font cells are formulas so if you enter a value, it’ll mess up the whole model. Only input in the blue font cells.
PRODUCTION
We’ve gone through the inputs and the calculation of gold production above, so we’ll skip this part. One important note is that in a DCF model for a mining company, there is no Terminal Value that catches the cash flows of an infinite period of time beyond a defined time period (for example, 5 years of defined time period and a terminal value for infinite period). The reason is that each mine has a maximum number of contained gold, so it won’t go forever.
GOLD PRICE
If you have access to professional databases like Capital IQ or Bloomberg, then you can look up analyst consensus of gold price forecast, but if you don’t, there are free sites that blog about gold price forecasts. The best place to pull analyst consensus is trustablegold.com. I approach valuations on the conservative side, so I’ve assumed a gold price of $1,300 in the mine start year of 2020 then decreasing to $1,100 until the end of the mine life.
REVENUE AND COSTS
Revenue is simply the recovered gold multiplied by the gold price.
We’ve covered the costs above, both operating costs and capex, so I won’t repeat it here.
The corporate tax rate is different for each mine depending on the country the mine is located in. For this mine, 30% was used. You can quickly look up the corporate tax rate like on KPMG’s table of country tax rates. (Note that there would be allowable tax deductions but these are not incorporated in the model.)
DISCOUNT FACTOR
The higher the risk the mine has in meeting the forecasts, the higher the discount rate. The industry standard is typically in the range of 8% – 12%, with the median being 9%. An example of a 12% discount rate would be for a mine that has political risk, mine development risk, production risk such as uncertainty that the mining method they anticipate will work or if the forecasts in the feasibility study are too ambitious and therefore meeting the forecast is unlikely.
Here, we’ve settled on the industry median of 9%.
NET PRESENT VALUE
We’ve now arrived at the valuation of the mine of $147.4 million. That wasn’t too bad, was it?
Finally, look at the company’s latest balance sheet and add cash and subtract debt to arrive at what the intrinsic value of the market cap is and compare it to the current stock price.
3. Company Website
Now that you know how to value a mine, the next step, which is just as important, is to assess the company qualitatively. This means reading the bios of the Management team and the Board of Directors to see if they have experience in successfully building a mine and using discipline in terms of costs. You can also skim through their press releases to see if they had run into any hiccups in the past related to the mine or any old assets. Or maybe they keep refinancing debt without being able to pay it down. Maybe their accounts payable is growing. Anything fishy or off that catches your eye. Having a keen eye on risk analysis is key.
How to Value a Mining Company, Part II: Base Metals, is coming soon, so subscribe to be notified when it is available!