https://www.investing.com/analysis/week-ahead-200213712
The Week Ahead
All times listed are EDT
Monday
5:00: Eurozone Inflation (August, final): expected to rise to 1.5% YoY from 1.3%, while core CPI holds at 1.2%.
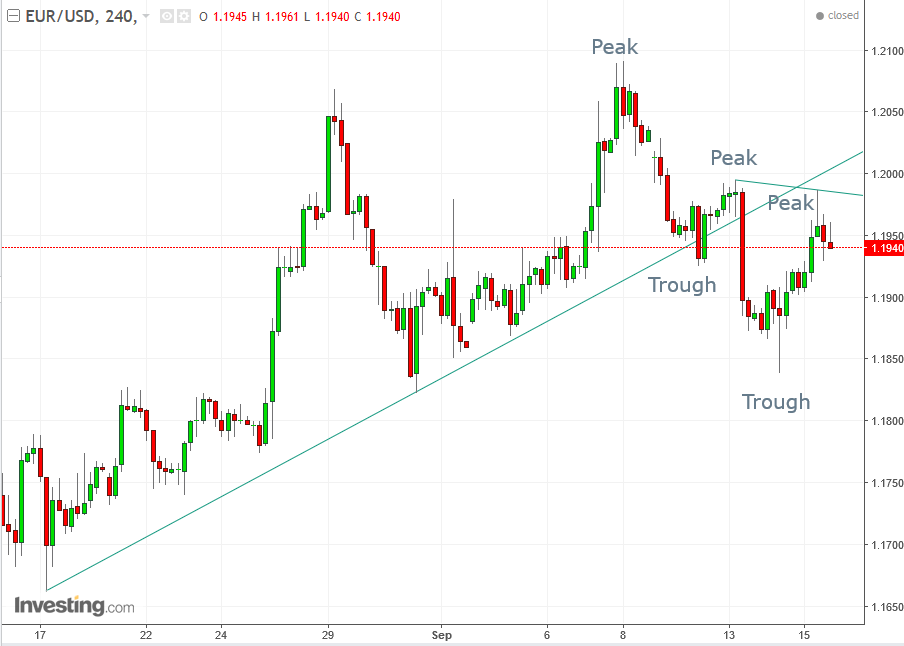
EURUSD 240 Minute Chart
In the short term, on September 13, the EUR/USD pair fell below its uptrend line since August 17 and by September 15, completed a return move. Although the return move to the violated uptrend line whose resistance held - came near to challenging the prior peak, the price was pushed back down, forming a powerful bearish Shooting Star, suggesting a resumption of the short-term decline, with a probability-based reliability above the 1.2000 key level.
11:00: UK BoE Governor Mark Carney Speaks: watch for any further comments on the outlook for monetary policy following on from the BoE meeting, at which policymakers expressed a view that rates should begin to rise in ˜coming months.
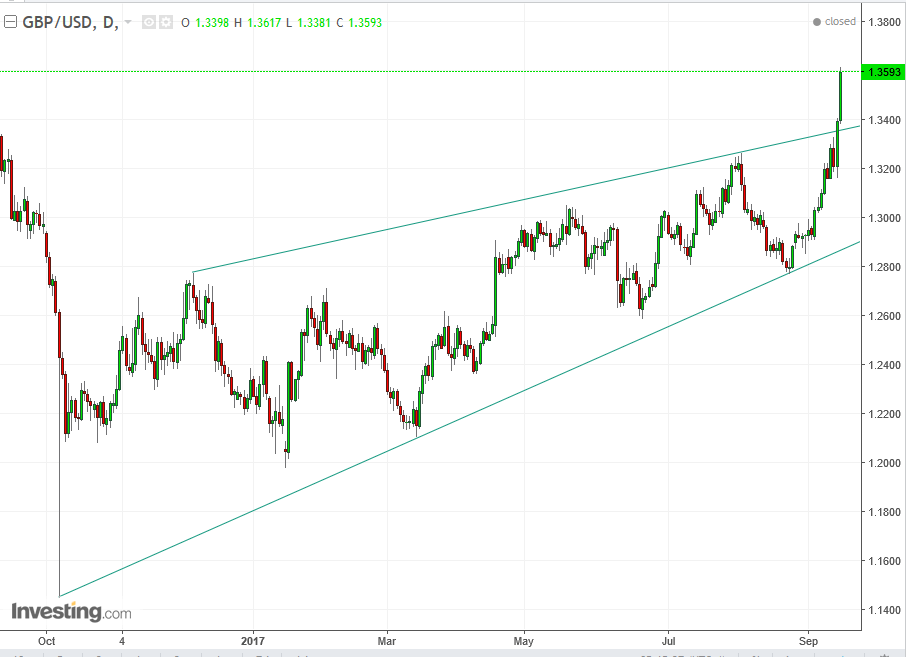
GBPUSD Daily
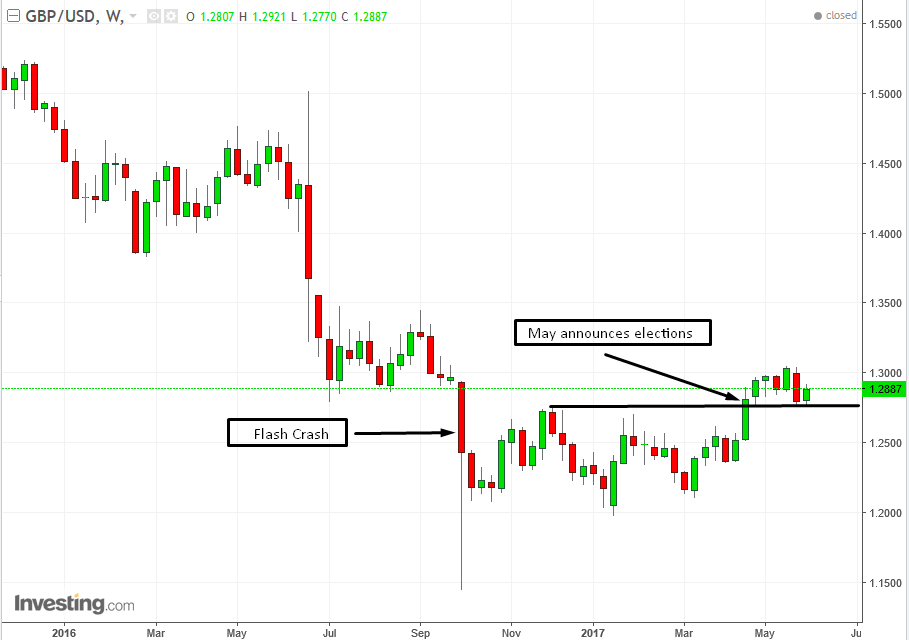
The pound surged 3 percent last week. On Thursday, the Bank of Englands minutes revealed that policy makers were ready to raise interest rates for the first time in over a decade. On Friday, BoE policy maker and Monetary Policy committee member Gertjan Vlieghe said:
œThe evolution of the data is increasingly suggesting that we are approaching the moment when bank rate may need to rise.
What was so exceptionally bullish about Vlieghes statement is that just this past July he told The Independent that a rate rise would be œpremature and a œmistake. No hawk can compete with a doves hawkishness.
Cable jumped to its highest level in 15 months, performing its best weekly gain since February 2009 and the fourth best weekly performance in 40 years.
In the mid-term, the cable is exceptionally bullish, as it is not only trading within an uptrend since the October flash crash, but it accelerated its rate of ascent as it flew right through what used to be the trends resistance, its channel top, now expected to become its uptrend-line support.
21:30: Australia RBA Meeting Minutes: these should help provide additional color on future policy direction from the Australian central bank.
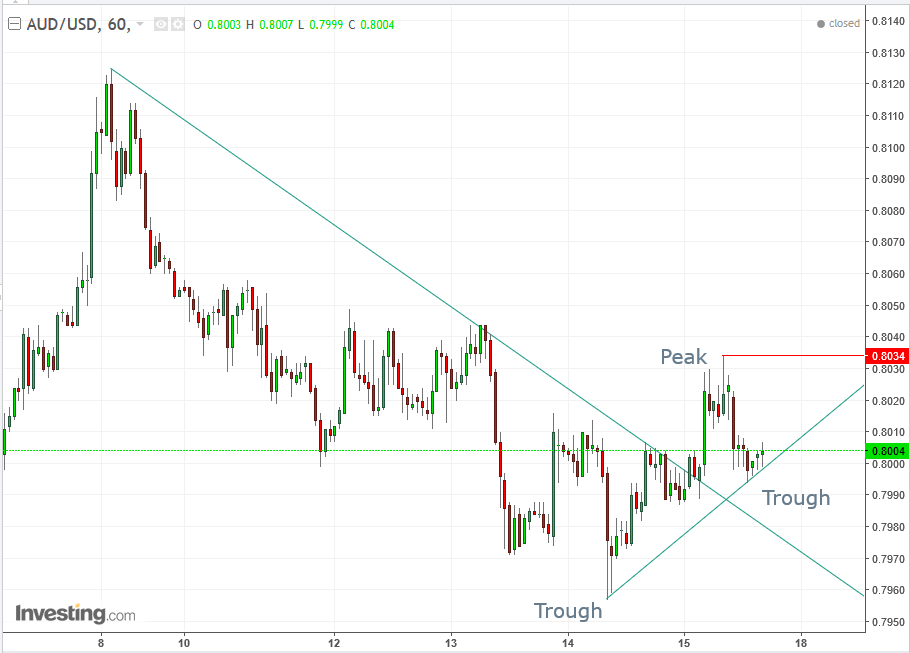
AUDUSD Hourly Chart
In the short term, the AUD/USD pair broke out of a downtrend beginning on September 8 when it crossed above it on September 15. However, it had not yet produced the minimum series of two peaks and troughs. It will have done so only if it crosses above the 0.8034, September 15 peak.
Tuesday
5:00: Germany ZEW Index (September): economic sentiment index expected to fall to 9.1 from 10.
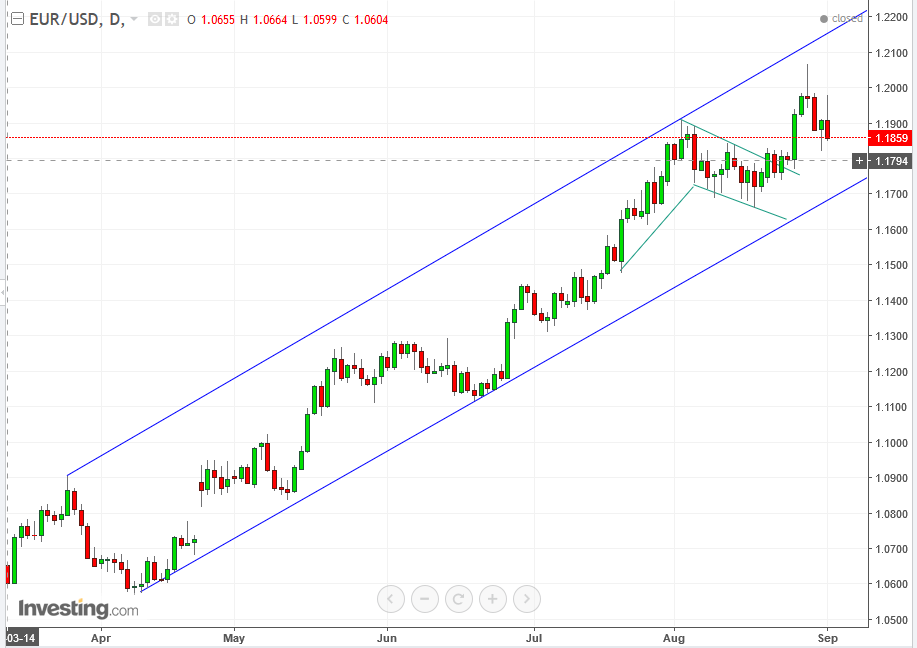
EURUSD Daily
In the near-midterm, the EURUSD pair has indicated a potential decline, after completing a bearish rising wedge, when it fell below the pattern on September 13, which produced a two-day rise, that was forced down upon reaching the pattern, in what appears to be a successful return move.
19:50: Japan Trade Balance (August): the previous figure was a surplus of ¥419 billion.
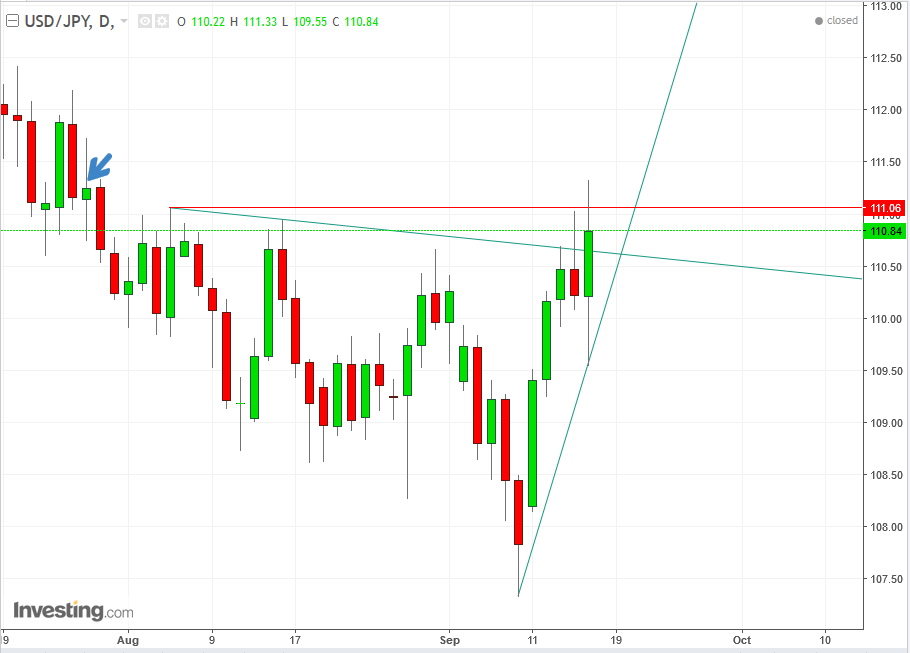
USDJPY Daily
In the short term, the USD/JPY pair is in a clear uptrend, since September 8, as the price closed above the short-term downtrend line since August 4, as well as closed at the highest price since July 27.
Wednesday
2:00: Germany German PPI (MoM) (Aug): expected to rise decline from 0.2 percent to 0.1 percent.
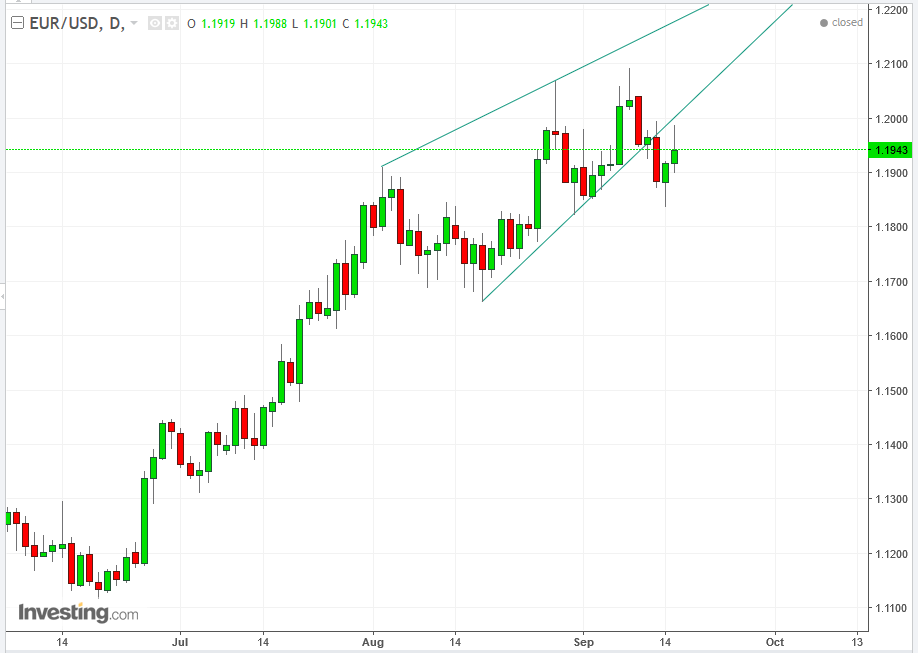
EURUSD Daily
While in the Tuesday section, above, we provided the bearish view in the mid-term, here's the fuller picture for the euro. The pair has been rising within a rising channel since April 11. While it fell out of what may prove to be a bearish rising channel, that move may be nothing more than a correction within the uptrend. While the price is within the channel, the presumption is it will keep rising.
4:30: UK Retail Sales (Aug): sales expected to grow 1.1% YoY from 1.3%, while the MoM figure falls to 0.2% from 0.3%.
GBPUSD Weekly
10:00: US Existing Home Sales (Aug): expected to rise to an annual rate of 5.5 million from 5.4 million.
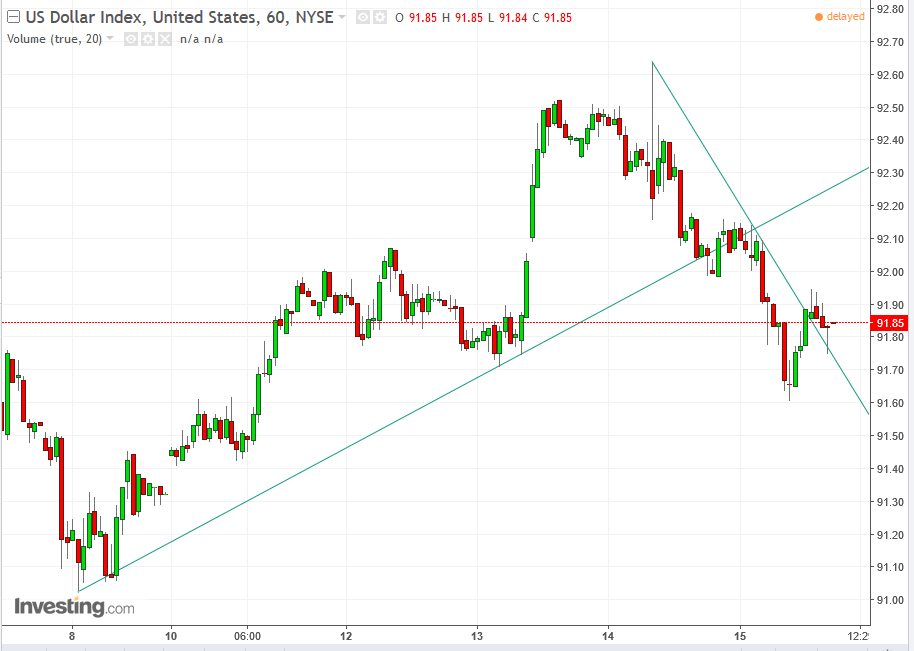
DXY Hourly Chart
In the short-term, the dollar is in a downtrend, while it is showing signs of resistance. The index ended its short-term uptrend since September 8, when crossing below it on September 14 and completing a successful return-move on September 15. However, later on it climbed back above the short-term downtrend line since September 14, as well as produced a power-hammer, completing its own return-move. However, the peak-trough analysis establishes the the downtrend is still intact.
10:30: US EIA Crude Inventories (w/e 15 Sept): previous weeks figure was a rise of 5.9 million barrels.
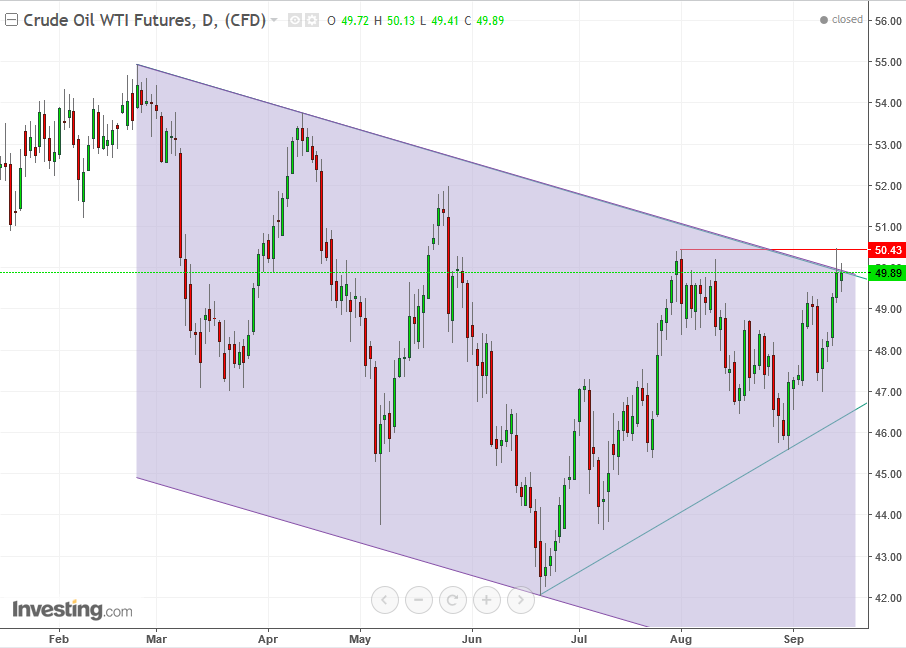
WTI Daily
For months now, we have been bearish oil. Fundamentally, US production was rendering OPEC / NOPEC cuts moot and drowning out demand. Technically, the price has been trading within a falling channel since February, in a clear demonstration that the bears are dragging down bulls by their horns.
However, for the first time in months, we are prepared to turn bullish on the commodity. Following are the fundamental reasons, followed by the technical picture:
After Harvey knocked out Texas-based refineries and effectively squelched their demand, sending prices down, the EIA showed there was a two week rise in US crude supply totaling more than 10 million barrels. Refineries beat recovery-time consensus and only 9 percent remain offline. Baker Hughes reported Friday that the number of active US rigs fell for the second consecutive week, by 7 to 749. Finally, OPEC / NOPEC have been meeting about extending the production curb past March of next year.
From a technical perspective, last Thursday, the price reached a high of $50.50. That move raised three red flags:
Honestly, this puts us in a dilemma. While all three violations occurred, it closed below them all, perhaps suggesting that the bears who rode the price down all the way from February had the last say. On the other hand, if you follow the price action from June 21, you might notice that its forming a potentially bullish, ascending channel, which demonstrates that buyers are more eager than sellers, as they are willing to buy at ever rising prices, as opposed to sellers who are not willing to sell at lower prices. For an Ascending-Channel call, however, a decisive break, including a close, should be registered. At this point, its just as likely to turn out to be a bull-trap. In the final analysis, we would consider a further rise an ideal short from a risk-reward standpoint, as the price is very close to its $50.50, Friday resistance, while it can fall with no expected resistance till the rising trendline since June 21 at $47-48.
- It penetrated the infamous downtrend line/channel-top since February for the first time.
- It penetrated the former, $50.43, June 21 peak
- It penetrated the psychological $50 key level, round number.
14:00: US FOMC Decision (press conference 2:30): no change in policy is expected, but watch for any indications that the outlook for rates is shifting, or whether the committee is still looking to raise rates once more this year.
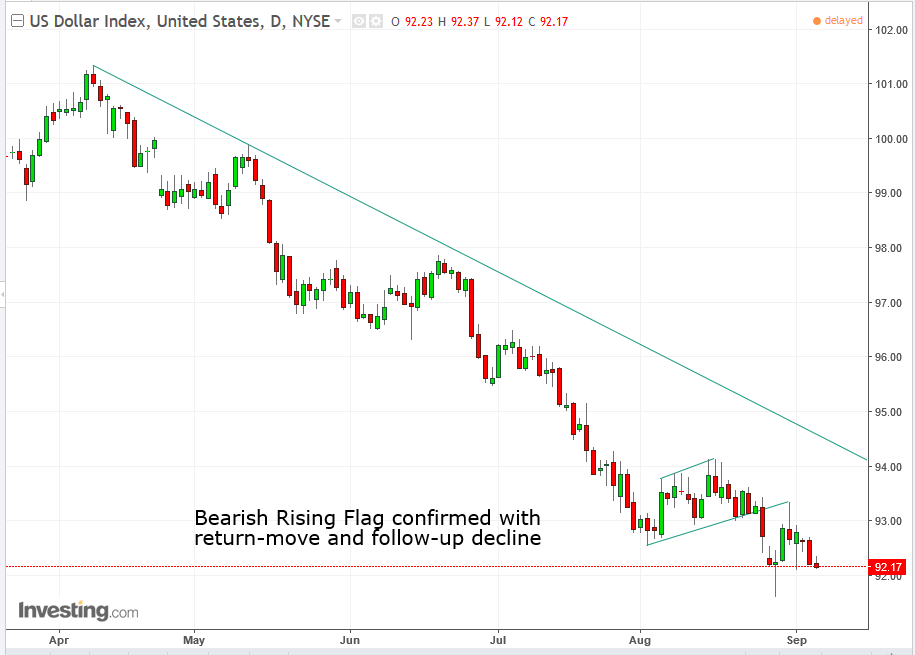
DXY Daily
In the hourly chart, above, we demonstrated that the greenback is in a short-term downtrend. The daily chart reveals that even going back over a month, to August 15, the trend is also down, as it has been trading within a down-channel. A rise toward the channel-top would provide another shorting opportunity.
23:00: Japan (Tentative) BoJ rate decision: no change in policy expected, watch for any commentary regarding further easing.
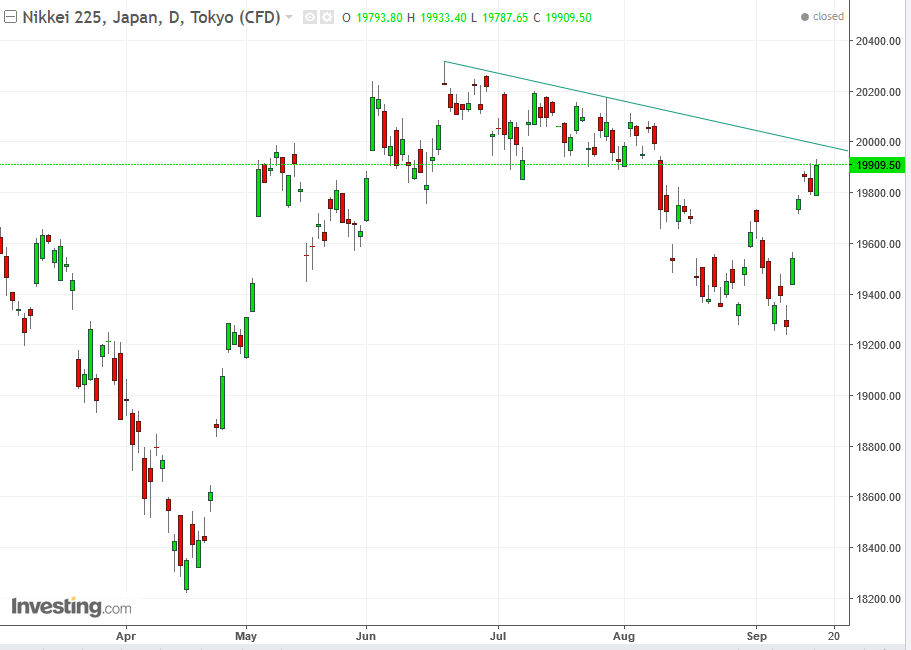
Nikkei Daily
While the Japanese Nikkei Index is within an uptrend, it failed Friday to overcome Thursdays shooting star, which is also situated beneath the downtrend line since June 20, as well as the thick congestion between June and August. This makes a correction highly likely, as well as provides an ideal short from a risk-reward perspective.
Thursday
8:30: US Initial Jobless Claims (w/e 16 Sept): expected to fall to 236K from 284K as the impact of hurricane-related disruption recedes.
Even a longer view”witness the daily chart, shown above”going all the way to March 9, demonstrates that the dollar-index is falling within a downtrend.
10:00: Eurozone Consumer Confidence (September, flash): expected to fall to -1.7 from -1.5.
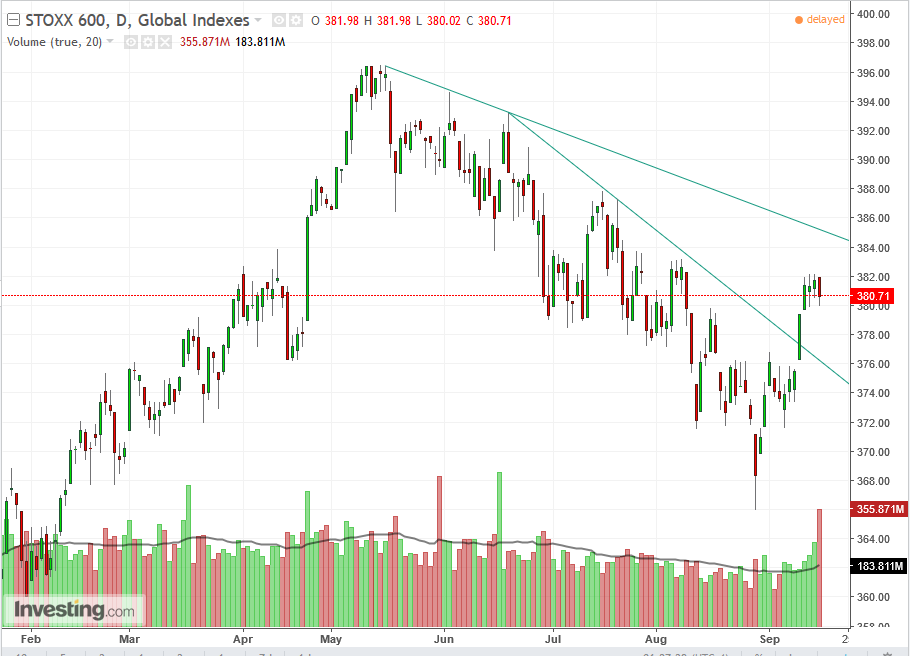
Stoxx 600 Daily
While the STOXX 600 Index has broken out of its downtrend line since June 20, it is still under its longer downtrend line since May 16. Also, the sharp decline on Friday, which wiped out two days of earlier gains, on the highest selling volume since May 31, increases the probability of a decline.
Friday
4:00 5:00: Eurozone French, German, eurozone PMIs (Sept, flash): watch for further signs of improvement in the services and manufacturing sectors, which could be positive for the euro.
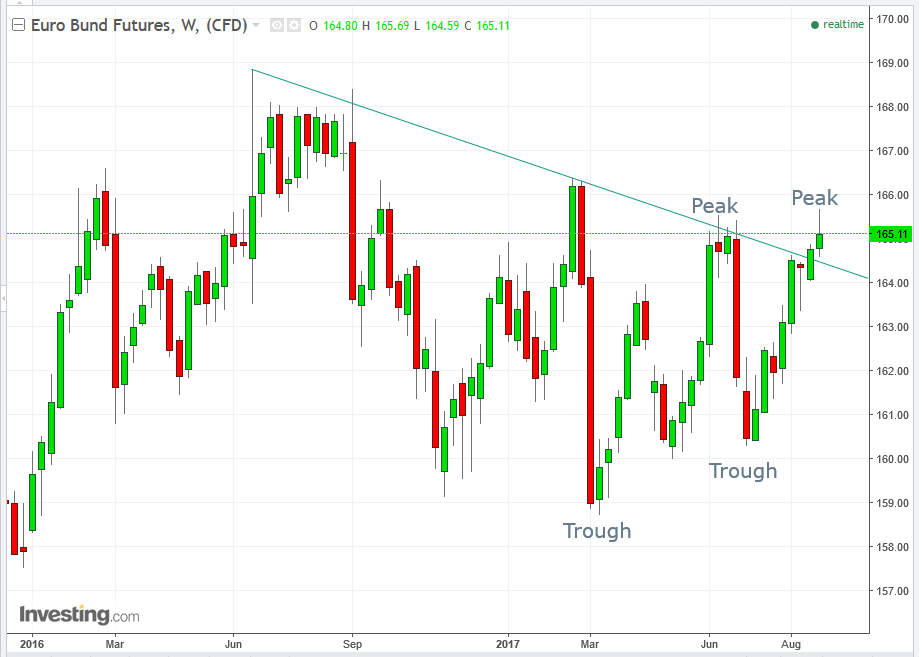
Euro Bund Futures Weekly 2016-2017
Yields for the Euro Bund closed less than 0.1 percent below the bottom of a symmetrical triangle, a continuation pattern. Since the yield has been traded within a falling channle since June, the presumption is that the yield will continue its decline, as the economic engine of the eurozone, which is the new global growth leader, continues to accelerate. However, to avoid a bear trap its preferable to wait for a 1-3 percent penetration, depending on risk aversion, before a yield-short/Bund long. An aggressive trader might actually go long, hoping for another bounce within the pattern, banking on the dreamlike risk-reward ratio, in case hes right.
8:30: Canada CPI (Aug): expected to rise to 1.5% YoY from 1.2%.
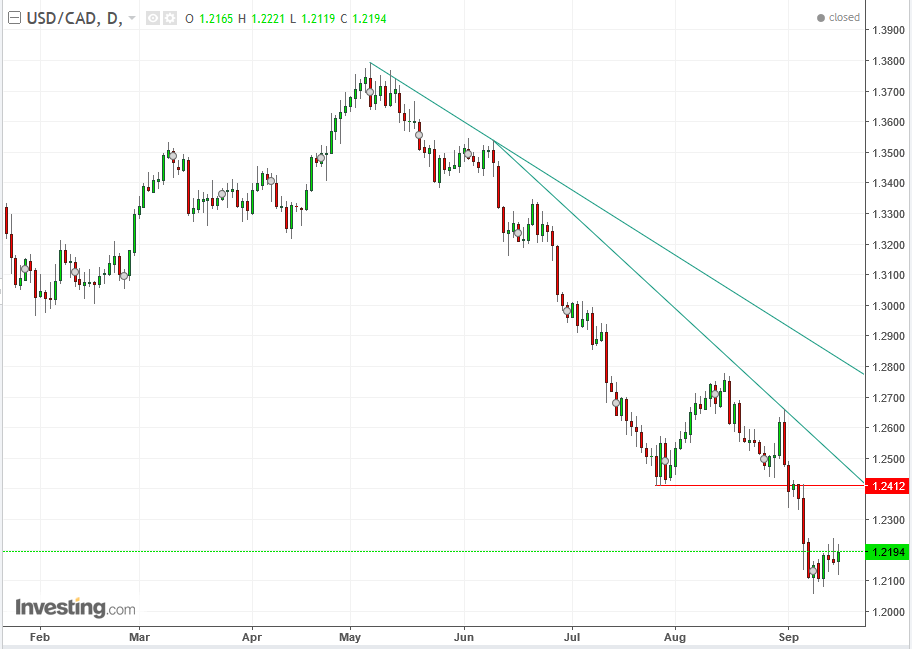
USDCAD Daily
The USD/CAD pair has been down-trending since May 5. A rising correction toward the downtrend line and the 1.2412, July trough may provide a œselling rally (as opposed to a œbuying dip).
9:45: US Services and Manufacturing PMI (September, flash): mfg expected to rise to 53.8 from 52.8, while services to fall to 52.4 from 56.
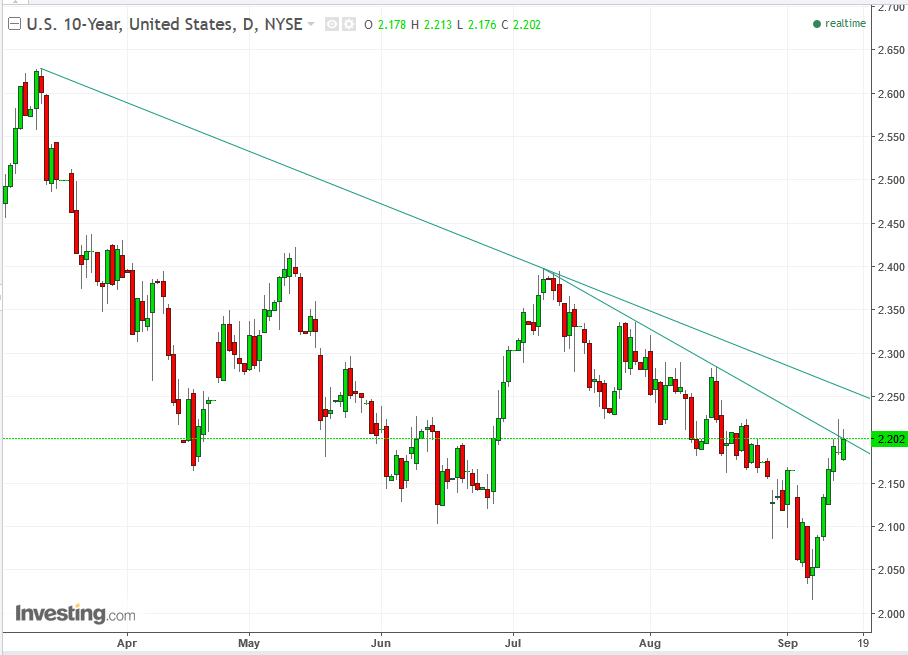
UST 10-Y Daily Chart
Yields have been rising since September 8, until Thursday when it reached its downtrend line since July 7, and was smacked down, producing a potent Shooting Star. It attempted a second go on Friday, but again closed below the downtrend line. Both failed attempts confirm its significance, suggesting yields may resume their downtrend, or Treasuries resume their uptrend
Short Term Trading Week Starting: 18 Sept, page-15
-
- There are more pages in this discussion • 217 more messages in this thread...


You’re viewing a single post only. To view the entire thread just sign in or Join Now (FREE)
Featured News
Featured News
The Watchlist
LGP
LITTLE GREEN PHARMA LTD
Paul Long, CEO
Paul Long
CEO
Previous Video
Next Video
SPONSORED BY The Market Online