http://reneweconomy.com.au/evs-and-...ide-and-why-it-will-be-bigger-than-lng-53685/
EVs and storage: Lithium’s wild ride and why it will be bigger than LNG
By David Leitch on 6 October 2017
It’s a boomer out the back – $1.5 billion to $9 billion lithium market in a decade
A bit over a year ago we had a first look at the lithium market. Since then what already looked exciting has become ever more so.
Three factors are driving the surge in optimism:
- The total cost of ownership [TCO] of, say, a Chevy Bolt, especially in Europe is already within 5% of the cost of a VW TSI Golf.
- Various government policy announcements have been very, very bullish.
- In the real world we can observe 38% growth for the first six months of the year and there are signs of acceleration. On the basis of these factors we say…
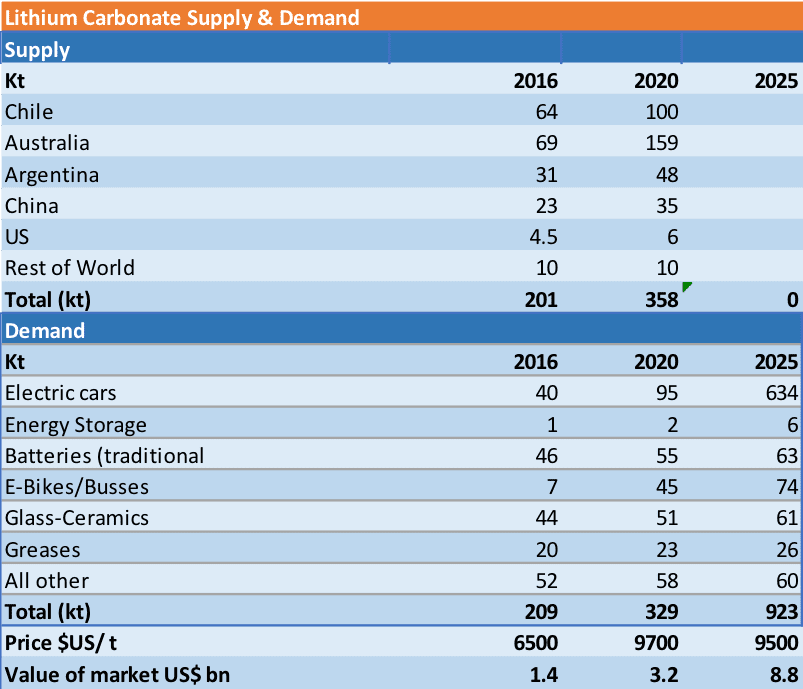
The lithium market is expected to grow from about US$1.5 billin in 2016 to maybe US$9 billion by 2025.
The current growth rate of the EV segment is 40% per year. Despite the seemingly endless new supply options, the reality so far has been that commissioning new lithium facilities has lagged well behind budget. In fact, we see by far the main challenge for the sector is keeping up with demand.
As a result lithium carbonate battery grade (the main product) prices could stay higher for longer (always a risky conclusion), and it is currently over US$10,00 per tonne. Canaccord Genuity forecasts prices averaging over US$10,00 a tonne out to 2025. Lithium represents only a small part of a battery cost.
At the growth rates we discuss in this note that will require perhaps US$10-US$12 bn of investment just for the lithium extraction capacity. That estimate is based on Roskill US$12,500/t LCE capex and a Lithium Carbonate market perhaps as much as 1 mtpa by 2026.
Those same numbers suggest that about 750 GWh of battery making capacity is required. That’s about 20 of the Tesla 35 GWh super factories and that first one was $5 billion, so you can expect up to US$80 -US$100 billion of investment in battery factories.
Those numbers are comparable with investment in total Australasian LNG manufacturing capacity. A key but unpublished number in the below table is the KWh of storage per EV.
We see this going to an average of 50 KWh by 2025. That could easily be too high and perhaps 35-40 KWh as an average would be better. Our thinking is that range anxiety is the second highest concern after car price and that as battery cost comes down manufacturers will address concerns via bigger batteries.
Figure 1: Lithium Carbonate supply & demand. Source: ITK adapted from Deutsche
EV & PHEV sales to total over 5 million by 2021 – It’s happening
In our view EV-Volumes.com are one of the few organisations keeping global data on EV vehicle sales, by region and by model, and also keeping associated battery chemistry sales records.
We choose to adopt their forecasts, even though they are at the upper end, because we think they are closer to the data.
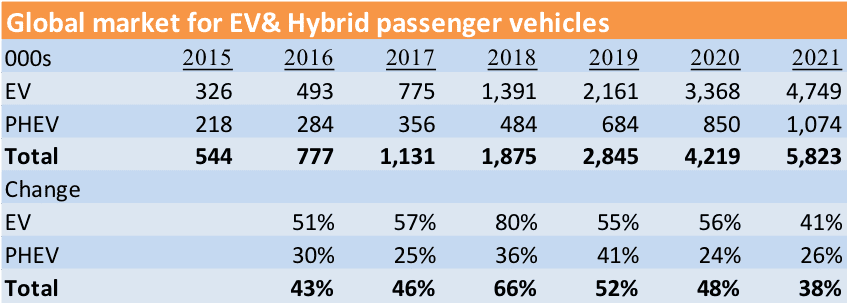
EV-Volumes.com estimate is for about 5X growth in total EV passenger car sales between 2017 and 2021. This would imply a slight acceleration in the annual growth rate.
We would not use higher numbers than those of EV-Volumes.com but we do think there is a good case for using higher than consensus numbers as at the moment at least forecasters tend to be revising up.
UBS, for instance, is significantly lower than us in 2021 in its May estimates, due to lower numbers from China. However, since May China has firmed up policy.
Even hybrid volumes are expected to triple but the real growth is in fully electric vehicles [BEVs].
Figure 6 EV sales forecasts. Source: EV-Vols.com
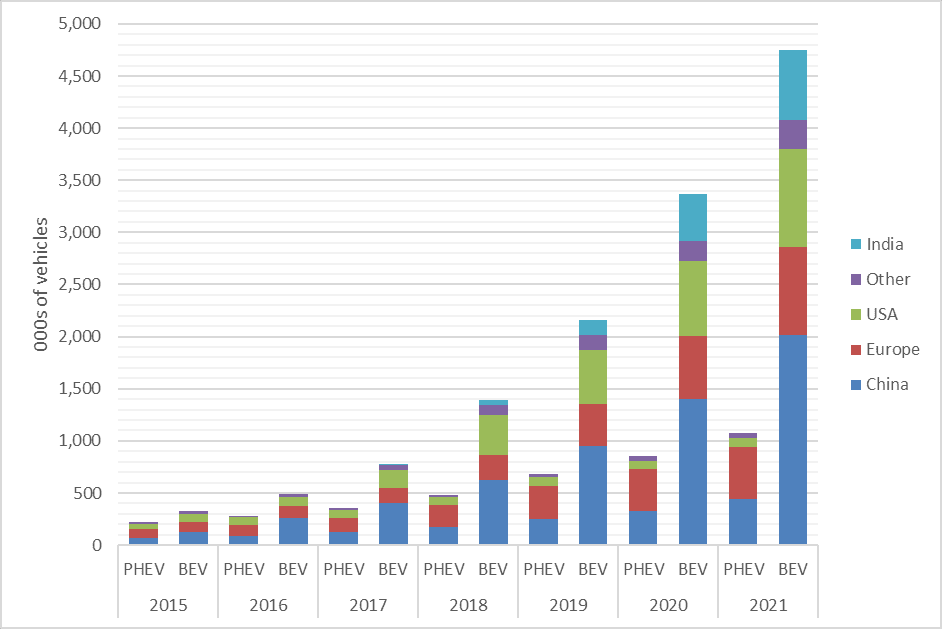
The following chart gives an indication of the regional numbers making up this forecast. If we had to question the numbers, it would be in the USA where despite the Tesla Model 3 and despite the Chevy Bolt, economics are relatively unfavourable for EVs.
That in turn mainly relates to the USA not taxing petrol consumption in the way that virtually every other country in the world does.
Figure 7: Regional forecasts of EV sales. Source: EV Volumes.com
2017 H1 Global EV sales up 38%. Not all EVs use big batteries
Similar growth rates are seen in all three major markets despite policy differences.
Figure 5: Plug in car sales. Source: EVvolumes.com
There is some data that suggests acceleration in the monthly numbers. For instance in Europe July was up 54% and August 69%. EVvolumes expect 0.5 m sales in China for the full year.
Many of the Chinese cars are small for instance the number 2 selling car in China in August was the Zhidou D2 Ev with just a 12 KWh battery.
Figure 8 Zhidou 120 km range, 90 kph max speed (down hill). Source: cleantechnica
Total cost of ownership [TCO] the major tipping point
UBS Electric vehicle research lead by Patrick Hummel is fantastically interesting. Your author had the pleasure of taking a very minor role on some of Patrick’s reports when he covered utilities prior to taking up the car manufacturing analysis role and in my opinion his research was the most interesting to read of any UBS analyst on any sector.
In May 2017 UBS published a ground breaking piece of research, as reported by RenewEconomy,that covered a “teardown”, by a specialist company, of the Chevy Bolt.
As discussed below, the teardown revealed a battery cost lower than expected. The teardown report was supplemented by an earlier online (2016) global survey of 9400 qualified people looking at the key concerns of consumers about BEVs [battery electric vehicles]. The main concerns were:
Figure 9: Consumer concerns about BEV. Source: UBS survey, 2016
EV manufacturers are addressing both of the two main concerns, purchase price and range. Access to plug in stations is very easily solved once suppliers decide there is a market.
TCO based on 3 year lease with 50% residual
Cost can be thought about in many ways, initial purchase cost v life time cost, consumer v manufacturer perspective, environmental cost. Here we focus on Total cost of ownership. UBS compares a Chevy Bolt v VW TSI Golf.
A 3 year lease, 50% residual model is used and the best comparison is found in Europe. Even in 2017 using the UBS data (partly confirmed by my own calculations) the TCO of the Golf is very close to the Bolt.
In bearing the below in mind the note of caution is that Bolt sales in the USA have climbed to 2632 in Sep 2017 or a 31 K annual rate from about a 12K rate in January, but this is still a tiny number relative to say Model 3 expectations of say 30K a month.
Figure 10: TCO, Bolt v Golf. Source: UBS
The Bolt initial purchase cost (US$37 k) , and along with other electric vehicles, is expected to come down about $/Euro 1000 per year or about 4% until say 2025.
The key source of cost reduction is batteries. We show selected numbers from the UBS analysis. Note the relative share of the inverter cost. Total cost comes down by about 1/3 over 8 years. A good improvement, but when utility PV costs fell 30% last year, hardly out of the ordinary.
Figure 11: Selected Chevy Bolt costs and forecasts. Source: UBS
The cell reduction costs comes from a change in chemistry (using less cobalt) and a change in energy density (less materials needed) as well as general manufacturing improvements.
Household battery buyers look at the above numbers and weep
A Tesla Powerwall 2 is A$8200 before GST & installation or A$607 KWh, so let’s call it US$500 KWh. That’s more than double the per KWh cost of a car battery which, using all the components in Fig 11 ,works to US$230 KWh.
Undoubtedly the inverter for household use costs more, but we still see that household batteries can come down a long way based on the above comparison
Global policy development brings manufacturing switch acceleration
Various Government/Regulators/manufacturers have made stronger than ever statements of intent in 2017.
- In Germany regulators have mandated all electric vehicle sales to be fully-electric by 2030 (3.4 m cars)
- France’s ecology minister (imagine one of those in Australia) has announced an end to the sale of petrol and diesel cars by 2040
- In Great Britain a similar policy has been adopted.
- Volvo will only make electric vehicles from 2019
- VW has targeted 1 m electric car sales by 2025
- China has adopted legislation requiring 8% of vehicle sales to be electric increasing to 12% by 2020 (2.2 m cars). These shares are measured in NEV [New energy vehicle] permits. 1 NEV permit is equal to 4 fossil vehicle permits which means that in reality the 12% target is actually about 3.4%. That’s still a lot of EVs
These are big announcements but in stockmarkets 2040 is an eternity away and even 2020 is hopefully a lot further away than the next bonus. The discount rate is about 20% for this.
Carbon and other emissions are driving policy
Policy towards EVs is so supportive partly because oil is around 1/3 of and the second largest contributor to global CO2 emissions, and partly because EVs provide fuel security. EVs are quieter, well suited to city commuting, including the use of busses and likely play well to autonomous driving trends.
Figure 3: Global carbon emissions. Source: CDIAC, 2014 latest data
The growth in battery electric vehicles, is not just in cars. In China at least busses are converting to electric, and a bus needs about 3X-4X bigger battery pack compared to say a Tesla Model 3. Electric bikes are becoming far more prevalent, even in Australia.
All this is producing a massive spike in the demand for the lithium. As such it represents one of the few ways for Australian investors in Australian share markets to get exposure to decarbonization themes.
Australia lead by the National Party is an ostrich on vehicle policy
Australia light vehicle emission standard is 1 gC/lm based on the Euro 5 standard. A ministerial forum was convened in December 2015 to consider tighter standards.
The proposed policy had the potential to increase fuel efficiency, saving consumers up to $500 per year and potentially reducing carbon emissions in Australia by as much as 10%. Following release of the proposed policy it became clear the Federal Govt. did not have enough internal support to get the policy mandated. What a disgrace.
As a result no final paper has been released by the forum. That said, QLD has just announced the Electric Vehicle Superhighway.
We have some of the dirtiest petrol in the world, are totally dependent on imports but its doubtful if senior members of the National Party, eg Ron Boswell, would even recognize a Tesla if it ran over him in the street.
Any mention of carbon is censored more strongly by the Federal Government than a Chinese netizen talking about personal freedom would be in Beijing. Still in the same way that Canute couldn’t hold back the tide the National Party won’t be able to hold back the wave of change sweeping the world and EVs are an important part of that.
Moving on to the lithium supply bottleneck
In our view supply considerations are the biggest bottleneck to the emerging growth forces for BEVs. We think the market has strongly underestimated the amount of new supply and investment in both lithium and battery manufacturing capacity.
For years investors have worried about over supply of lithium but this is not what we see. To us it seems like manufacturing lithium has so far proved to be a relatively difficult process with projects late and over budget to an extent. As global production goes up learning rates should drive costs down and this will bear watching.
Roskill, in a quite optimistic May presentation talking about the 1 MTPA future Lithium market noted the following head and tailwinds.
Column 1 Column 2 1 Headwinds Tailwinds 2 End of, or reduction in, incentive schemes; vehicle prices Cost reduction in battery and EV drive components 3 low oil prices CO2, SOX, NOX mandates/ city national targets 4 Supply Chain constraints Simpler design and build large scale battery factories 5 Raw material availability Improved efficiency & recovery, upstream investment 6 Charging infrastructure Network expansion, improved range 7 Range Improving cell performance 8 Availability Greater number of models 9 Lower car ownership Shared services like autonomous driving more suited to Evs 10 Look/feel of ICE models Younger drivers more used to high-tech
Column 1 1 Figure 4: Roskill pros & cons for elecrtric vehicles. Source: Roskill Australia remains a “digger” and financier
Australia presently supplies about 35% of the world’s lithium, in hard rock “spodumene” form. The ore is further processed, mainly in China, to produce Lithium Carbonate. It’s presently more capital expensive, but lower overall cost, and arguably more environmentally friendly, to produce lithium carbonate from evaporating brines.
These brines can be found in South America for the most part and a number of Australian listed companies are active in the South American market including Galaxy Resources and Orecobre.
The relative LRMC advantage of the brine producers over spoduemene hard rock processors is somewhat under question due to the higher spec (99% lithium carbonate) grade required for batteries and the extra processing cost required to produce this grade at brine facilities.
The listed lithium sector in Australia has a market cap of around A$4 bn, still small but growing rapidly. We do not distinguish or comment on the merits or otherwise of any of these stocks. Investors are cautioned to do their own research.
Figure 2 Selected Lithium focused stocks. Source: Factset, prices as of Oct 5
Raw materials used in lithium batteries
We take our numbers from Argonne Labs BatpaC model. However most of the estimates for lithium production and sales are measured in lithium carbonate Li2CO3. 0.8 kg of Li2CO3 =
Figure 12: Raw materials in lithium car batteries
Lithium reserves by geography and deposit type
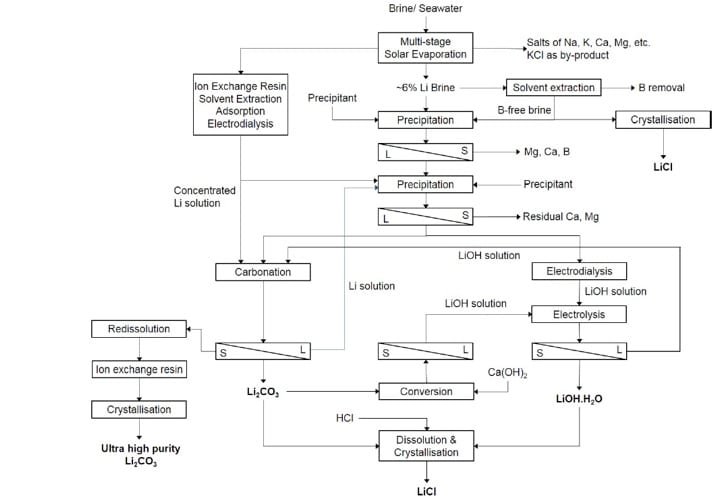
Lithium carbonate of battery grade (99.5%) can be produced in two ways.
- By evaporating brines and then purifying via solvent extraction absorption and ionic exchange followed by recrystallisation. About 75% of the global lithium reserves are in brine form with Chile the largest single source.
Figure 13: Lithium process chemistry. Source: Deutsche from Swiaowska 2015
2. Spodumene deposits are recovery via open pit mining and “beneficiated” via gravity to produce a 6% Lithium Carbonate grade. The concentrate is then typically shipped to China to a converter where it is roasted, leached and ion exchanged to produce 98% or 99% Lithium carbonate About 19% of global lithium resources are Spodumene and about 11% of global total lithium resources are in Australia.
Disclosure. The author of this note is the beneficial owner of shares in lithium miner Orecobre.
David Leitch is principal of ITK. He was formerly a Utility Analyst for leading investment banks over the past 30 years. The views expressed are his own. Please note our new section, Energy Markets, which will include analysis from Leitch on the energy markets and broader energy issues. And also note our live generation widget, and the APVI solar contribution.


Add to My Watchlist
What is My Watchlist?