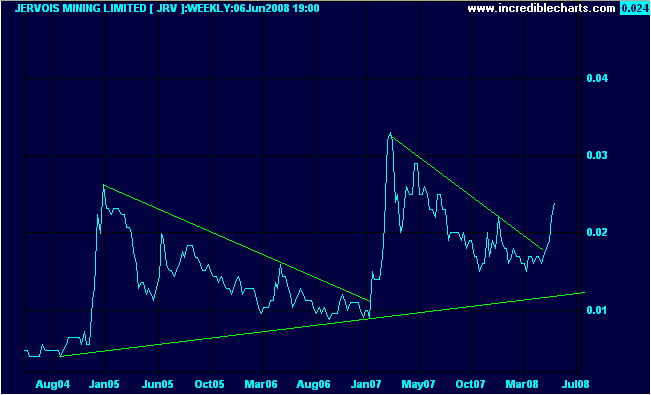
Here is a 4 year Jervois chart. Its plotted on a weekly basis to eliminate noise. The rest is self-explanatory.![]()
- Forums
- ASX - By Stock
- JRV
- ta for jervois
ta for jervois
-
- There are more pages in this discussion • 26 more messages in this thread...
You’re viewing a single post only. To view the entire thread just sign in or Join Now (FREE)
Featured News
Add JRV (ASX) to my watchlist
|
|||||
Last
1.9¢ |
Change
-0.002(7.50%) |
Mkt cap ! $48.64M |
Open | High | Low | Value | Volume |
1.9¢ | 2.0¢ | 1.8¢ | $5.468K | 284.1K |
Buyers (Bids)
No. | Vol. | Price($) |
---|---|---|
19 | 9703494 | 1.8¢ |
Sellers (Offers)
Price($) | Vol. | No. |
---|---|---|
1.9¢ | 60126 | 3 |
View Market Depth
No. | Vol. | Price($) |
---|---|---|
18 | 9693494 | 0.018 |
8 | 2101344 | 0.017 |
11 | 5479769 | 0.016 |
14 | 12933135 | 0.015 |
12 | 3856223 | 0.014 |
Price($) | Vol. | No. |
---|---|---|
0.019 | 68648 | 3 |
0.020 | 1179258 | 3 |
0.021 | 1731833 | 9 |
0.022 | 800000 | 2 |
0.023 | 2033760 | 5 |
Last trade - 11.34am 19/07/2024 (20 minute delay) ? |
Featured News
JRV (ASX) Chart |