I posted the irony of this on 12th june (stoploss thread), with the Richard Dales volatility based stop loss for Metastock and this Ichimoku chart, the chart is not available on that thread.
The irony continues?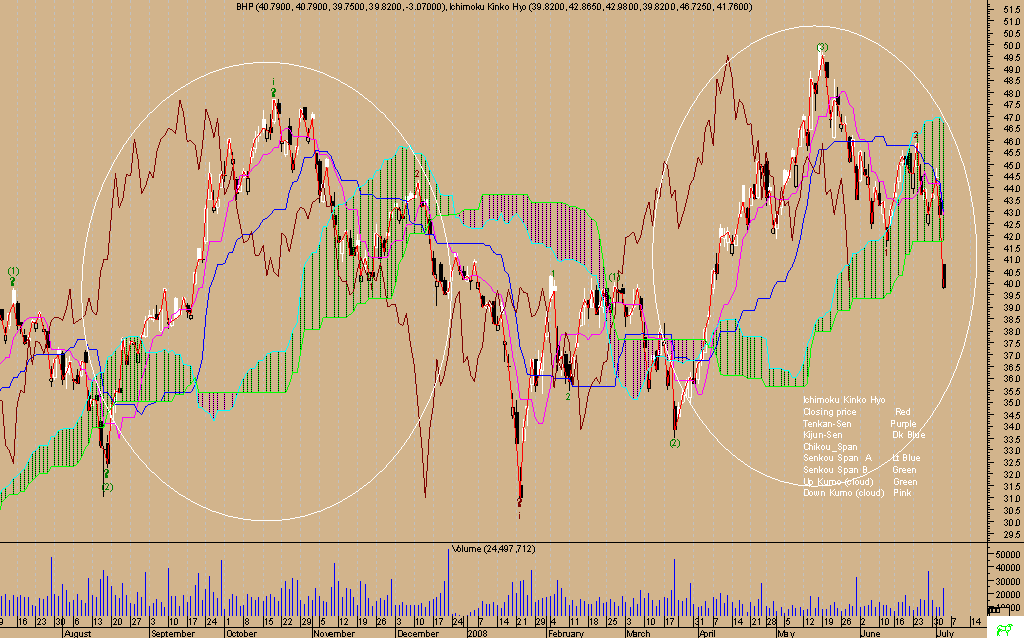
history repeats chart


Add BHP (ASX) to my watchlist
 (20min delay) (20min delay)
|
|||||
|
Last
$39.36 |
Change
0.550(1.42%) |
Mkt cap ! $199.5B | |||
| Open | High | Low | Value | Volume |
| $39.19 | $39.77 | $39.10 | $188.4M | 4.764M |
Buyers (Bids)
| No. | Vol. | Price($) |
|---|---|---|
| 18 | 1653 | $39.36 |
Sellers (Offers)
| Price($) | Vol. | No. |
|---|---|---|
| $39.37 | 2363 | 14 |
View Market Depth
| Last trade - 14.06pm 13/09/2024 (20 minute delay) ? |
| BHP (ASX) Chart |