Hi aaragon
Thats pretty close
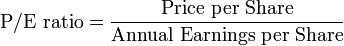
To get your P/E ratio (price-to-earnings ratio)
Once you have you ratio you need to see what your sector is operating at. At present the energy sector is about 21.85. I hadn't checked it for a couple of weeks and it has come back a bit, (strange no one got me on that yesterday). If your P/E is below the average you can keep increasing your share price on your spread sheet to you reach the average and this will give you a rough idea of where by rights the price should be at.
OEX Fully diluted market=169,308,985
And say OEX earning for 2009= 17million
At the current share price that would give you a P/E ratio of 9.66 for the P/E of OEX to reach the sect average you would have to increase your MC, in this case to $380,945,216.25 divide your MC by the amount of shares on issue and that gives you a share price of $2.25
If the P/E average is above the sectors P/E or say more than 25 usually means that the share price is to high and may come down a bit or the company has excellent earnings. OSH is a excellent example of that with a P/E of around 30.84 and has been above 30 for some time.
This is a great tool to work with and when you see people making statements about where the share should be you can quickly check it for yourself.
Hope that helps mate
Cheers
Ciggys
highly significant oil discovery.., page-24
-
- There are more pages in this discussion • 3 more messages in this thread...


You’re viewing a single post only. To view the entire thread just sign in or Join Now (FREE)
Featured News
Add SYN (ASX) to my watchlist
Currently unlisted public company.
The Watchlist
TON
TRITON MINERALS LTD
Adrian Costello, Executive Director
Adrian Costello
Executive Director
Previous Video
Next Video
SPONSORED BY The Market Online