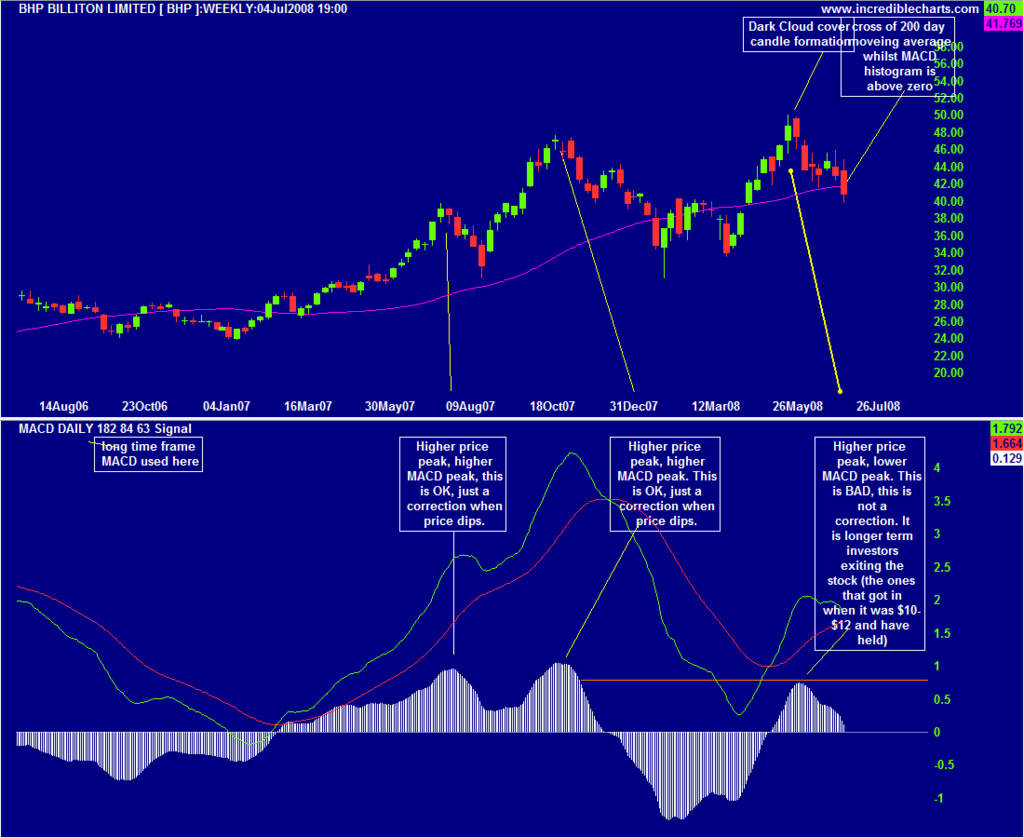
As Cwliew can attest to, I have been bullish on BHP for a long time, and even in the depths of the August correction maintained a $46 (sept) then $50 (dec) price target on the stock. So it's not that I'm a habitual party pooper. This slide is different than the earlier corrections and I believe indicates a more fundamental change by big big investors about where and how the world is headed for the next four to five years. Its not necessarily that the resources boom is over, it just might be that BHP has already captured the whole of the booms expectation in its share price, or it could be that they see difficulties in the cost/return ratios going forward, or that they see supply catching up with expanding demand that expands at a slower rate or any number of other factors. I don't know what they are thinking, I just know they are selling, and they have been selling for the last four months. and more importantly, they aren't buying back on the dips.
a chart for longer term investors to consider


Add BHP (ASX) to my watchlist
 (20min delay) (20min delay)
|
|||||
|
Last
$40.01 |
Change
0.800(2.04%) |
Mkt cap ! $202.9B | |||
| Open | High | Low | Value | Volume |
| $40.07 | $40.25 | $39.67 | $474.9M | 11.69M |
Buyers (Bids)
| No. | Vol. | Price($) |
|---|---|---|
| 1 | 15864 | $40.01 |
Sellers (Offers)
| Price($) | Vol. | No. |
|---|---|---|
| $40.03 | 1196 | 1 |
View Market Depth
| Last trade - 16.10pm 16/08/2024 (20 minute delay) ? |
| BHP (ASX) Chart |