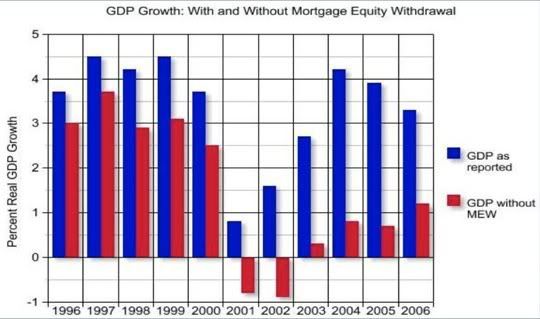
emark, i am quite gloomy for the medium term. look at this graph.
markets long term should move up for about 17 years and then consolidate for the same length of time. the us boom of recent years was one made of fairy dust. Natural growth finished around 99/2000 but the party was kept going by creating an artifical housing bubble with irresponsible lending. So many americans now have negative equity, there are millions of us houses surplus to requirements. home equity will not be helplng the US economy for many years to come. Not only must they finally face their 17year consolidation but they must now also pay for the sins of the past few years. If the Pharaoh of Eqypt knew what the US did in the last few years he would roll over in his pyramid. So much for storing up wealth during the 17 years of plenty for the 17 years of famine.
robbbb recently put up a chart of the DOW in the early 1900's. during that banking crisis the DOW lost nearly 50%. in the 66 to 82 consolidation the DOW bleed 45% in value through 73-74. That may well be a typical amount to shed in such times. Atm we are only a bit over half way there.
that's not to say we will not have a strongish bear market rally at some point.
- Forums
- ASX - By Stock
- XJO
- support level
XJO
s&p/asx 200
Add to My Watchlist
0.32%
 !
8,773.5
support level, page-30
Featured News
Add to My Watchlist
What is My Watchlist?
A personalised tool to help users track selected stocks. Delivering real-time notifications on price updates, announcements, and performance stats on each to help make informed investment decisions.
 (20min delay) (20min delay)
|
|||||
|
Last
8,773.5 |
Change
28.300(0.32%) |
Mkt cap ! n/a | |||
| Open | High | Low |
| 8,745.2 | 8,821.0 | 8,745.2 |
Featured News
| XJO (ASX) Chart |


