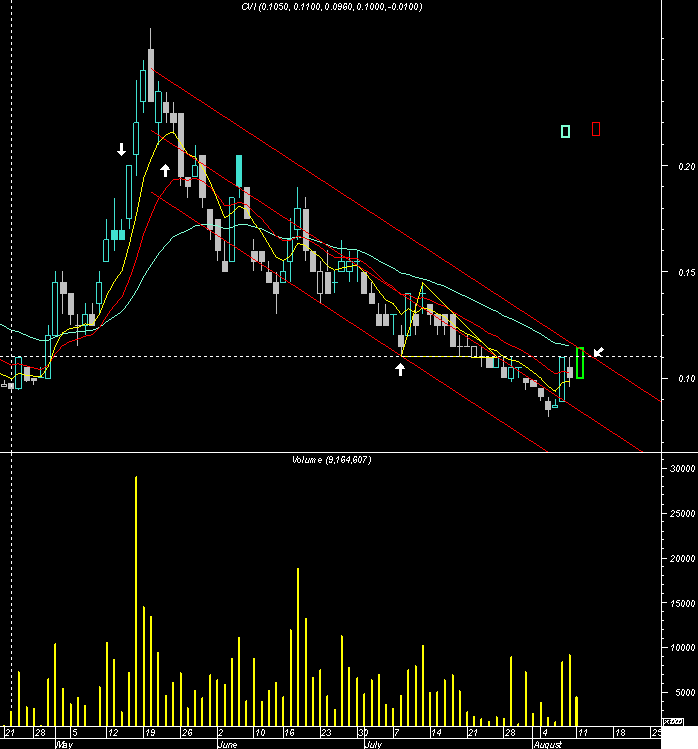
Back to the old chart when 11c was the descending triangle support base.
11c is now resistance.
Just a kiss chart showing the 7.14 and 30 EMA's and current standard error channel attempting a breakout, as mentioned elsewhere, insufficient accumulation and momentum for this just yet.
Bugga the intraday bigcharts have just gone down
perhaps worth checking back on for momentum detail


Add to My Watchlist
What is My Watchlist?