Morning all Just thought I would share my humble observations, thanks for the chart views fellas. I have noticed that OZL could be forming a rounding bottom pattern, which is bullish.. Right now it is constrained in a sideways channel between 1.63 and 1-85 ish. However if you check the charts with only a year or so of data, maybe we have the makings of a massive rounding pattern??? This is my opinion only, I hold the stock. Good trading to all Cheers
Commy
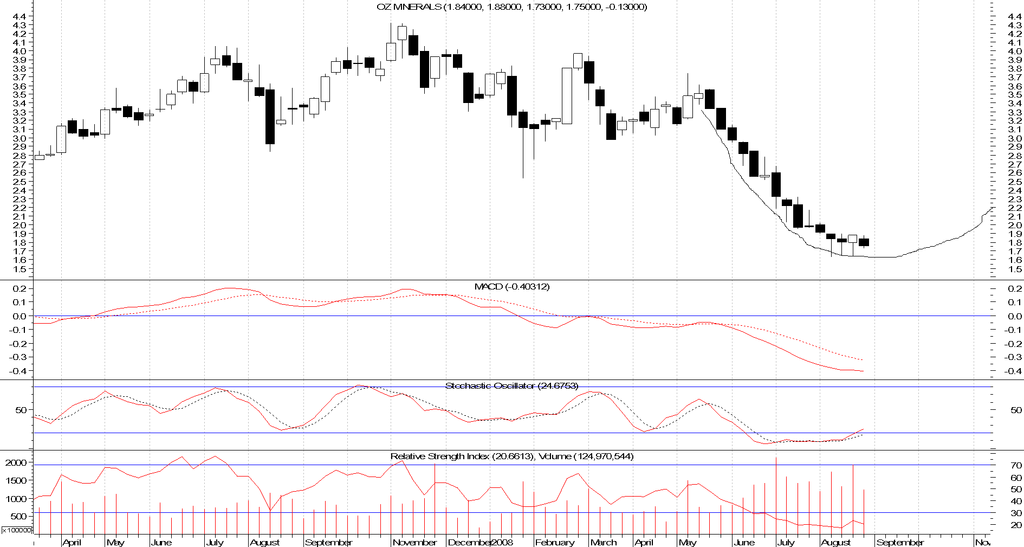
Daily chart looks like this
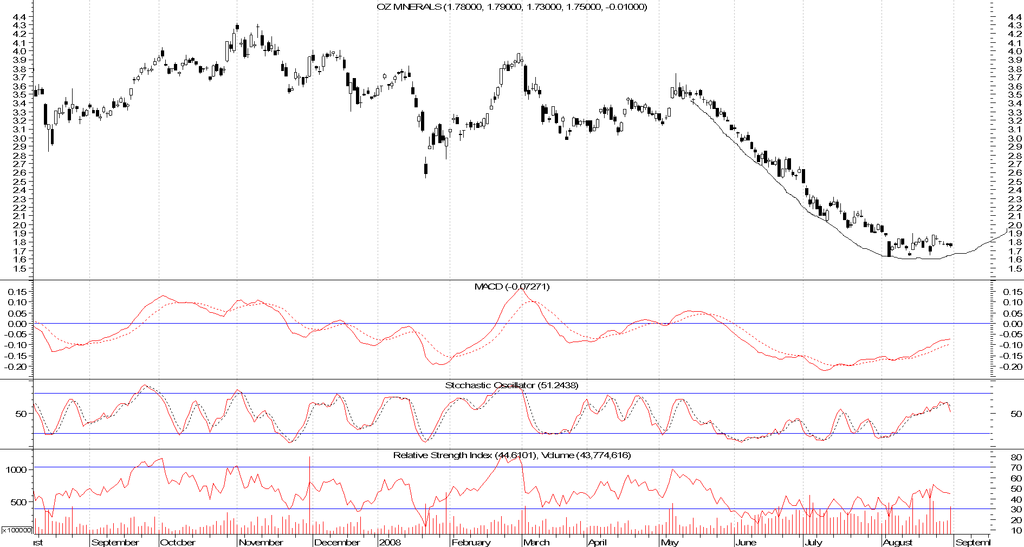
Weekly charts looks like this
OZL Price at posting:
0.0¢ Sentiment: LT Buy Disclosure: Held