Oh OK thanks
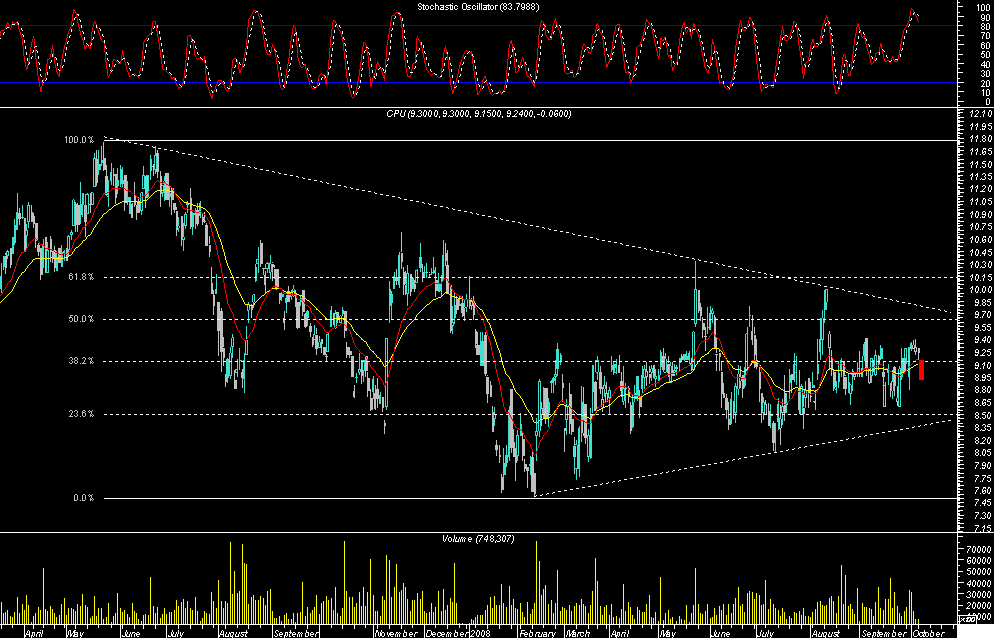
I think these are the fibs you suggested...
You may have more faith in the Fibonacci sequences than I do but todays action recovering from the gap down and reaching the 38.2% Fibline does show a lot of traders use Fibs
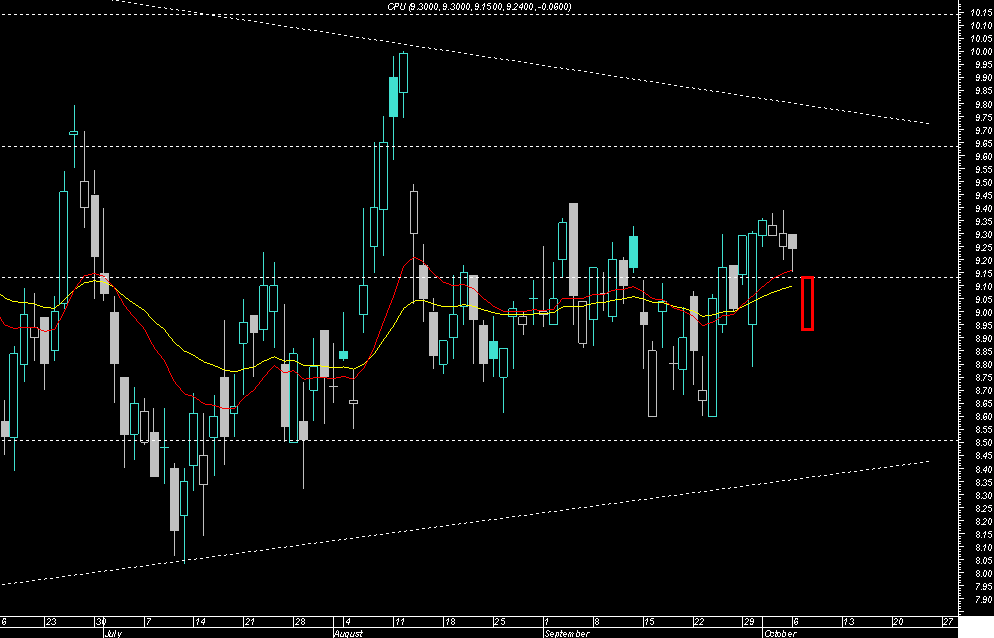
Heres the overbought stochastics from last night but combined with a recent drop off in volumes indicates the 900 to 910 region should be an accumulation level for a while and today may close on some sort of doji star candlestick pattern, which means its at an equal bull/bear balance or procrastination point..
doing nicely retracing the opening gap atm
yesterdays low was 915 its 913 atm..
and the 38.2 fib is 912 (approx)
john
- Forums
- ASX - By Stock
- CPU
- chart for rg
CPU
computershare limited.
Add to My Watchlist
2.65%
 !
$37.12
chart for rg
Featured News
Add to My Watchlist
What is My Watchlist?
A personalised tool to help users track selected stocks. Delivering real-time notifications on price updates, announcements, and performance stats on each to help make informed investment decisions.
 (20min delay) (20min delay)
|
|||||
|
Last
$37.12 |
Change
0.960(2.65%) |
Mkt cap ! $21.46B | |||
| Open | High | Low | Value | Volume |
| $37.12 | $37.33 | $36.17 | $62.54M | 1.687M |
Buyers (Bids)
| No. | Vol. | Price($) |
|---|---|---|
| 1 | 200 | $37.12 |
Sellers (Offers)
| Price($) | Vol. | No. |
|---|---|---|
| $37.14 | 64 | 1 |
View Market Depth
| No. | Vol. | Price($) |
|---|---|---|
| 1 | 200 | 37.120 |
| 1 | 407 | 37.100 |
| 1 | 1000 | 36.990 |
| 1 | 270 | 36.860 |
| 1 | 27 | 36.300 |
| Price($) | Vol. | No. |
|---|---|---|
| 37.170 | 13 | 1 |
| 37.390 | 283 | 2 |
| 37.500 | 440 | 1 |
| 37.800 | 263 | 1 |
| 38.000 | 1436 | 2 |
| Last trade - 16.10pm 10/09/2025 (20 minute delay) ? |
Featured News
| CPU (ASX) Chart |
The Watchlist
EVR
EV RESOURCES LTD
Shane Menere, Non-Executive Chairman
Shane Menere
Non-Executive Chairman
SPONSORED BY The Market Online


