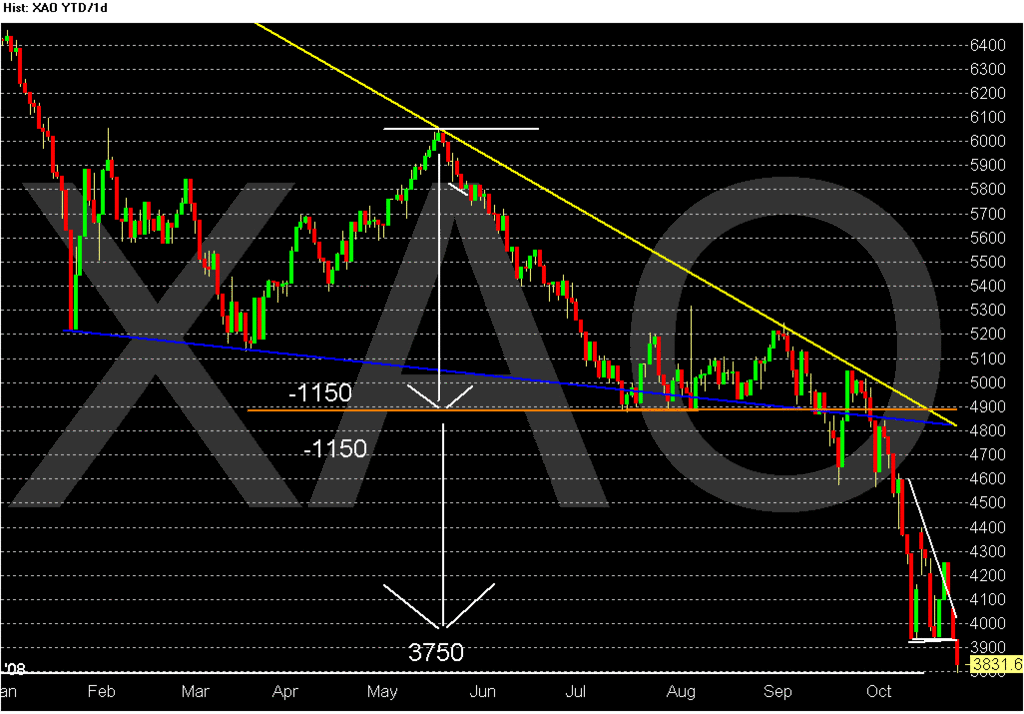
Triangles, wedges -- take your pick.
This daily chart is for the XAO, and shows how it should work. Subtract bottom line (4900) from high high (around 6050) and the 1150 result is then the anticipated fall from that bottom line.
- Forums
- ASX - By Stock
- XJO
- black friday approaching in usa tonight
black friday approaching in usa tonight, page-37
Featured News
Add XJO (ASX) to my watchlist
 (20min delay) (20min delay)
|
|||||
|
Last
8,224.0 |
Change
30.600(0.37%) |
Mkt cap ! n/a | |||
| Open | High | Low |
| 8,193.4 | 8,239.4 | 8,193.4 |
Featured News
| XJO (ASX) Chart |


