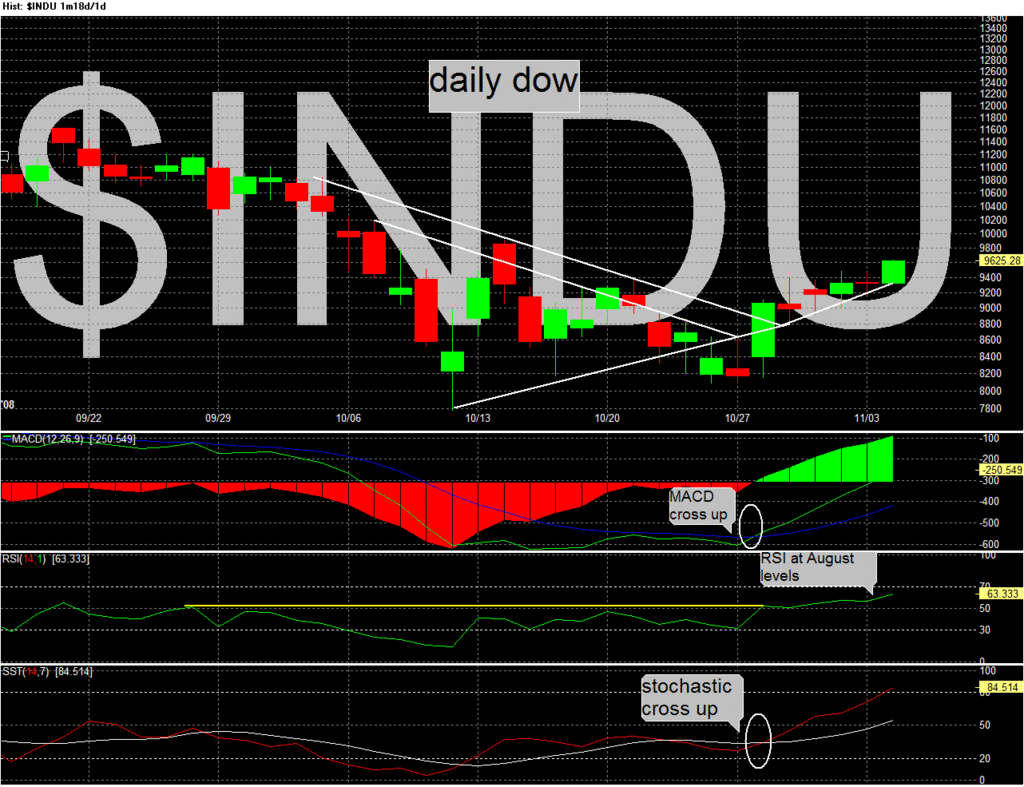
Dow daily is looking good, has broken well and truly north out of its triangle. Indicators have turned up and advanced, and stochastic will soon reach "oversold" lol.
The second daily chart shows the 9-day moving average crossing up through the 25-day. The 9 (green) 25 (blue) and 50 (yellow) moving averages crossed bearishly down in mid August.
- Forums
- ASX - By Stock
- XJO
- election wednesday
XJO
s&p/asx 200
Add to My Watchlist
0.32%
 !
8,773.5
election wednesday, page-5
Featured News
Add to My Watchlist
What is My Watchlist?
A personalised tool to help users track selected stocks. Delivering real-time notifications on price updates, announcements, and performance stats on each to help make informed investment decisions.
 (20min delay) (20min delay)
|
|||||
|
Last
8,773.5 |
Change
28.300(0.32%) |
Mkt cap ! n/a | |||
| Open | High | Low |
| 8,745.2 | 8,821.0 | 8,745.2 |
Featured News
| XJO (ASX) Chart |


