Hmm so what was that suggestion
some folk may be happy to scalp 10% on open and buy back in..spot on atm..
be a long slow recovery.at that rate.but a solid accumulation channel usually leads to a higher distribution level
IMO will also move better when 95 resistance is rebroken it does look like the next significant barrier.Here are some Andrews .standard error and fib price levels to consider..
Current pattern is a double tweezer bottom reversal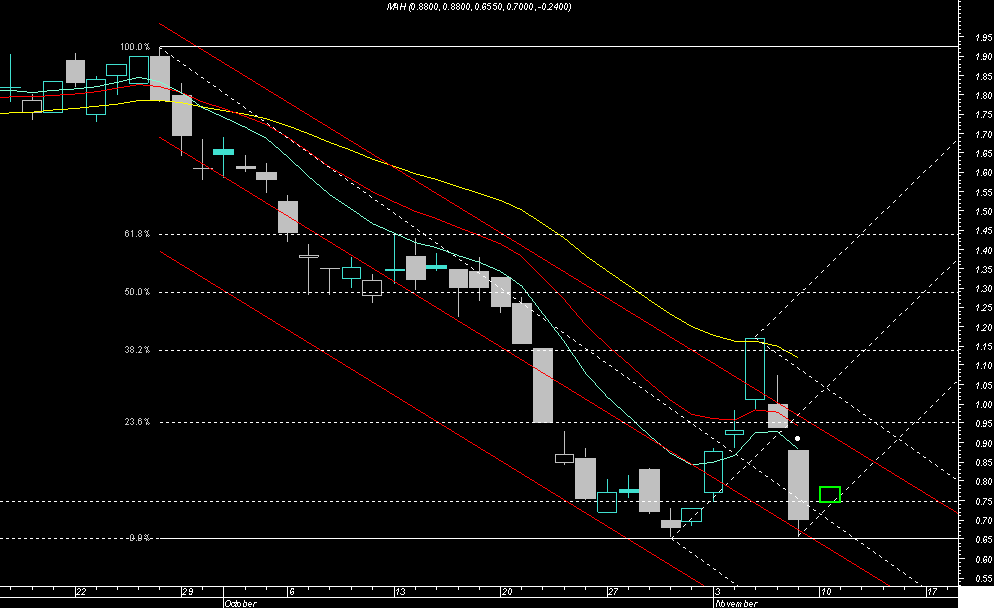
chart


Add MAH (ASX) to my watchlist
 (20min delay) (20min delay)
|
|||||
|
Last
35.5¢ |
Change
0.000(0.00%) |
Mkt cap ! $765.0M | |||
| Open | High | Low | Value | Volume |
| 35.0¢ | 36.5¢ | 34.5¢ | $894.4K | 2.535M |
Buyers (Bids)
| No. | Vol. | Price($) |
|---|---|---|
| 1 | 57400 | 35.0¢ |
Sellers (Offers)
| Price($) | Vol. | No. |
|---|---|---|
| 35.5¢ | 5495 | 1 |
View Market Depth
| Last trade - 16.10pm 18/10/2024 (20 minute delay) ? |
| MAH (ASX) Chart |