Robbbbb,
I'd love to agree with you there is a slim hope but its not looking good..imo
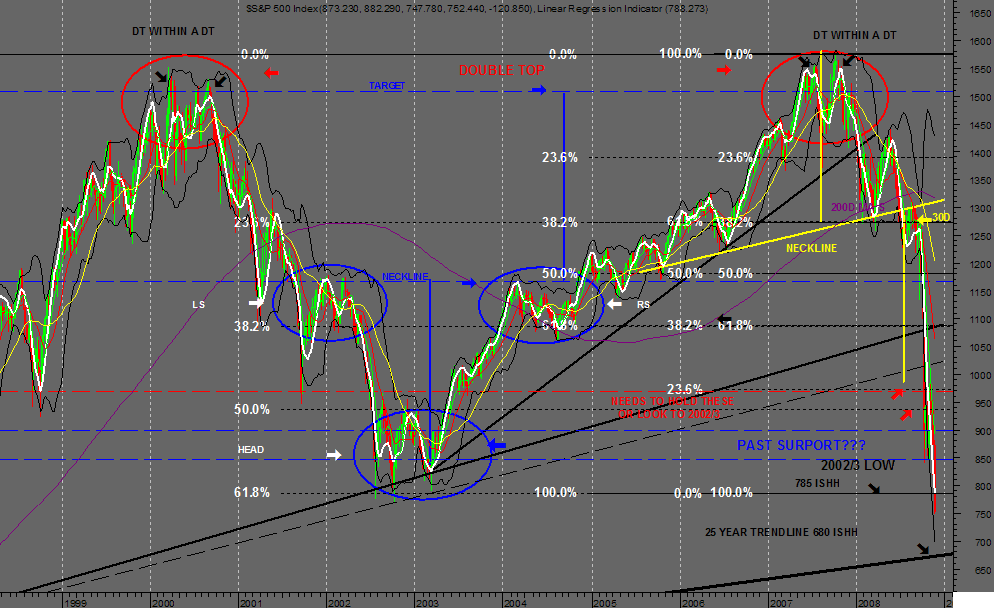
SP500 Weekly is only 30 odd points below the 100% fib from 2002 and the Double Tops 1st Target so could be a trade through?
There is a 25year trendline at 680 ish.
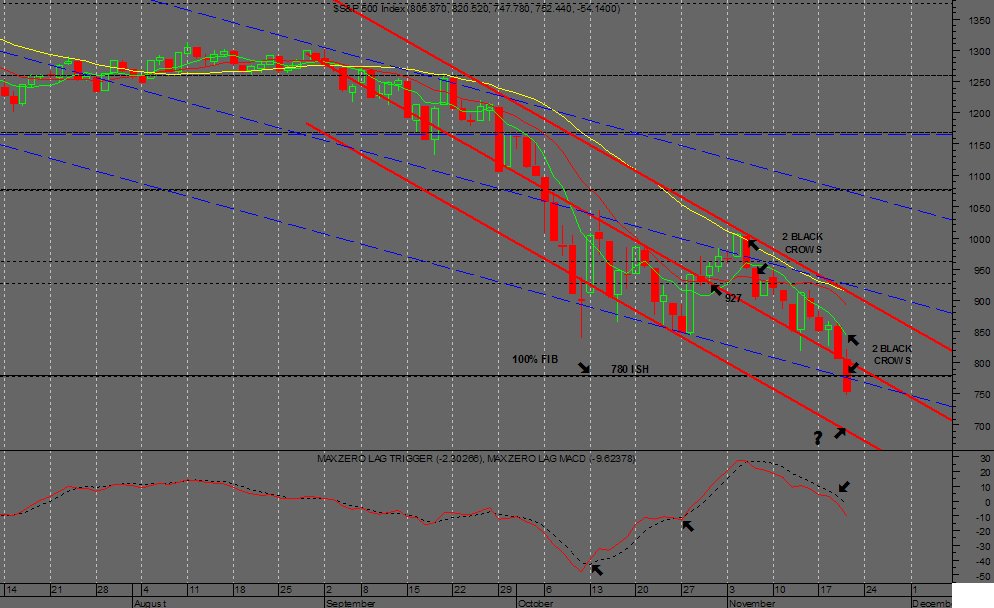
Daily Chart has brokern the longer SEC in Blue now looks to be using the newer one in Red 2 Black Crows are the candles they can come in 3 Macd is scary.imo plus its Friday..lol.
Cheers Pete
Add to My Watchlist
What is My Watchlist?


