FYI
Recce Pharmaceuticals (RCE)
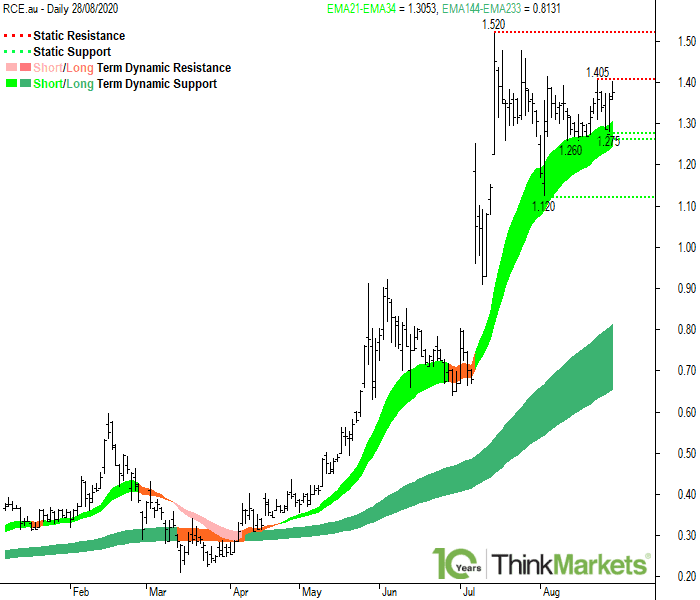
Recce Pharmaceuticals is in a well-defined short term uptrend, as evidenced by the 21 EMA located above the 34 EMA and with each EMA rising. The long term uptrend is also well-defined, as evidenced by the 144 EMA located above the 233 EMA and with each EMA rising.
Static resistance will be encountered at the 24 Aug 2020 high of 1.405, and then at the 16 Jul 2020 high of 1.520.
Static support will be encountered at the 27 Aug 2020 low of 1.275, which coincides with the 12 Aug 2020 low of 1.275.
Note that static support at 1.275 coincides with dynamic short term support expected to be encountered in the zone defined by the 21-34 EMAs, projected between 1.250 and 1.305. Whenever multiple support factors coincide, the market response at the zone defined by these factors tends to be stronger.
Beyond 1.520, RCE is at all-time highs, and therefore targets are open ended. Note however, static resistance will likely be encountered at the 2.00 round number.
Traders may wish to buy at the static and dynamic support zones with stops set below these levels. If this cannot be achieved, then traders may have to consider buying on a breach of 1.405.


 (20min delay)