Evening all.
Just a different topic for ANZ for a change.
While I do feel sorry for those caught up in opes, this is just a technical analysis on the chart.
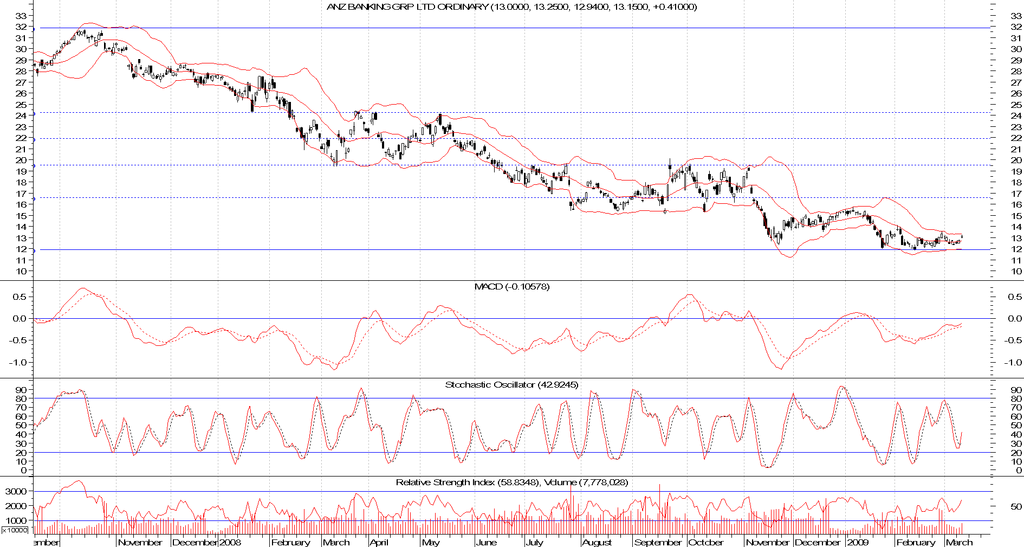
The daily chart looks like this.
I note some bullish divergence on the rsi, the stochastics have rolled up and the MACD is looking like it is going to bounce off itself instead of crossing down (a bullish event)
The fibonacci levels from its all time high to the low on the 12 feb 09 have many confirmations and to my mind it could possibly try and retrace back to $16-50 or the 23.6% fib level.
Last price resistance was $13.52 so that needs to be broken first, followed by $14.10 and then $15.71.
Of course this is only my opinion and i do hold the stock.
Cheers to all
Commy
- Forums
- ASX - By Stock
- ANZ
- chart just to break up the opes stuff
chart just to break up the opes stuff
-
- There are more pages in this discussion • 3 more messages in this thread...
You’re viewing a single post only. To view the entire thread just sign in or Join Now (FREE)
Featured News
Add ANZ (ASX) to my watchlist
 (20min delay) (20min delay)
|
|||||
|
Last
$32.13 |
Change
0.420(1.32%) |
Mkt cap ! $95.69B | |||
| Open | High | Low | Value | Volume |
| $31.76 | $32.15 | $31.25 | $240.8M | 7.570M |
Buyers (Bids)
| No. | Vol. | Price($) |
|---|---|---|
| 1 | 383 | $32.08 |
Sellers (Offers)
| Price($) | Vol. | No. |
|---|---|---|
| $32.13 | 8919 | 3 |
View Market Depth
| No. | Vol. | Price($) |
|---|---|---|
| 1 | 383 | 32.080 |
| 1 | 1000 | 32.070 |
| 1 | 5513 | 32.060 |
| 1 | 15498 | 32.040 |
| 1 | 300 | 32.030 |
| Price($) | Vol. | No. |
|---|---|---|
| 32.130 | 784 | 1 |
| 32.140 | 150 | 1 |
| 32.150 | 1991 | 4 |
| 32.160 | 233 | 1 |
| 32.170 | 1001 | 1 |
| Last trade - 16.10pm 08/11/2024 (20 minute delay) ? |
Featured News
| ANZ (ASX) Chart |
The Watchlist
EQN
EQUINOX RESOURCES LIMITED.
Zac Komur, MD & CEO
Zac Komur
MD & CEO
SPONSORED BY The Market Online


