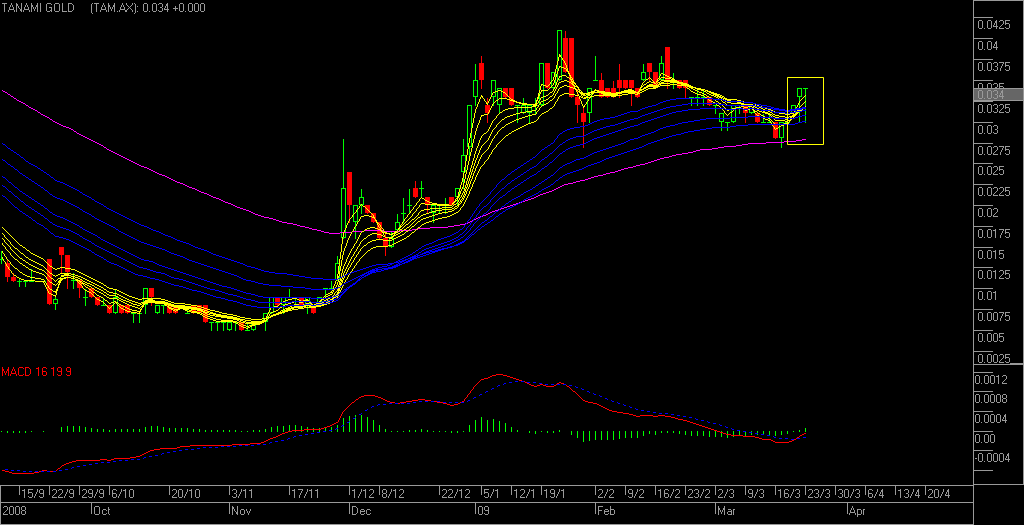
pretty bullish looking scenario here
the short term(yellow)and long term(Blue) moving averages here are both pulling up together in unison ie;were at the point where traders and investors are both fueling this uptrend
- Forums
- ASX - By Stock
- TAM
- chart
TAM
tanami gold nl
Add to My Watchlist
0.00%
 !
5.7¢
chart
Featured News
Add to My Watchlist
What is My Watchlist?
A personalised tool to help users track selected stocks. Delivering real-time notifications on price updates, announcements, and performance stats on each to help make informed investment decisions.
 (20min delay) (20min delay)
|
|||||
|
Last
5.7¢ |
Change
0.000(0.00%) |
Mkt cap ! $66.98M | |||
| Open | High | Low | Value | Volume |
| 5.9¢ | 5.9¢ | 5.7¢ | $144.5K | 2.528M |
Buyers (Bids)
| No. | Vol. | Price($) |
|---|---|---|
| 2 | 455137 | 5.7¢ |
Sellers (Offers)
| Price($) | Vol. | No. |
|---|---|---|
| 5.8¢ | 10263 | 2 |
View Market Depth
| No. | Vol. | Price($) |
|---|---|---|
| 2 | 455137 | 0.057 |
| 1 | 457251 | 0.056 |
| 1 | 200000 | 0.055 |
| 1 | 100000 | 0.054 |
| 1 | 100000 | 0.051 |
| Price($) | Vol. | No. |
|---|---|---|
| 0.058 | 10263 | 2 |
| 0.059 | 582814 | 4 |
| 0.060 | 864808 | 5 |
| 0.061 | 797724 | 2 |
| 0.062 | 390046 | 2 |
| Last trade - 15.28pm 16/09/2025 (20 minute delay) ? |
Featured News
| TAM (ASX) Chart |


