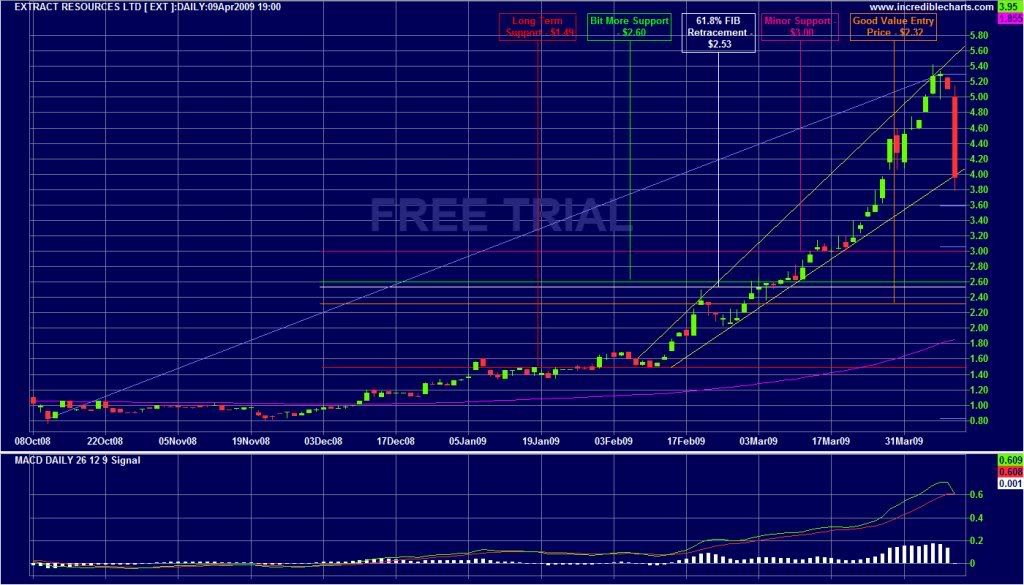
From a technical point of view, this does not look good and most would suspect the sell off to continue on Tuesday.
There are a few critical levels on the chart:
The first one is the closest, but not much of a support line @ $3.00 even, most likely could easily be broken.
The next level has a bit more support @ $2.60, nothing of real strength though, which may well be broken as well, however this area coinsides with the 61.8% FIB Retracement level of $2.53, so it may stabilise in this area...!
The entry level and fair value most technical chartists will be looking at is $2.32, which offers the most support of recent times, If this line is penetrated, run for the hills...lol, because it looks like the next station and long term support is @ $1.49.
Good luck all
EXT Price at posting:
$3.92 Sentiment: Sell Disclosure: Not Held
A personalised tool to help users track selected stocks. Delivering real-time notifications on price updates, announcements, and performance stats on each to help make informed investment decisions.


 (20min delay)