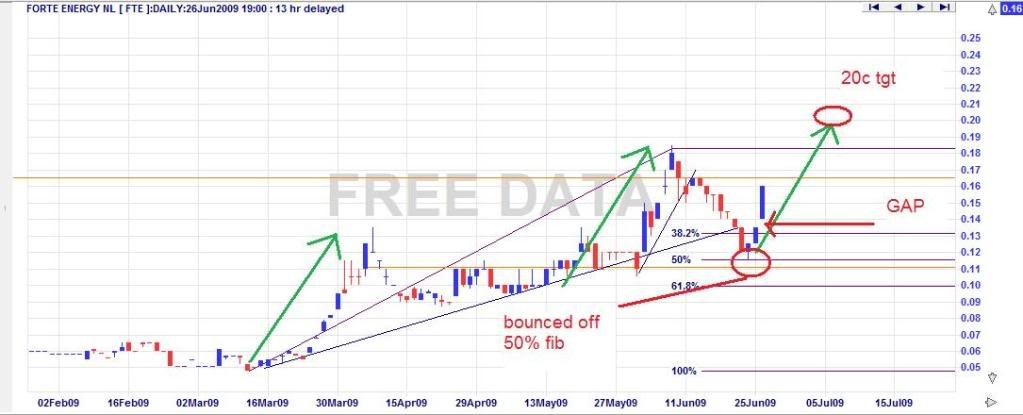
Hi guys and girls, heres a few charts for those interested.
The first one is displaying some speed angles along with the fib retracement and the gap that has been exposed on yesterdays open. Watch for that to be closed at some time the future.
The next chart is the Stochastic chart, we can see it has now turned upward, i have added a price channel which we should see the top hit which will colleralate with my TGT of 20c on the previous chart. It also displays the 21day moving average which we dipped below this week but yesterday gapped above it to close strongly at the days high of 16c.
the next one is the releative strength, note how the support became resistance shortly but how it crosses exactly at the 50 buy line.
Add to My Watchlist
What is My Watchlist?


