just a note for cycle fans.
friday 12th June was 610 days from the Oct 07 top....one day error thursday 11th has been the peak of this rally so far so obviously the fib count was significant in that case.
last thursday the 25th was 89 weeks from the top. It was a big up day and was a high for the dow but the SPX was eclipsed oh so slightly on friday, intraday, by 0.58 of a point but thursday was the higher close.......maybe some significance there.
This week we have thursday 2nd July being 90 weeks from the top of the US market and friday the 3rd being 610 days from the top of the Aussie market. i wonder if that little cluster may also be of significance. So what to make of the possibilities ?? A fall tonight in the US (despite strong futures at the minute) may indicate a final leg of this correction playing out by weeks end....that may be bullish for the medium term. If we rise tonight, and we continue to rise till the end of the week, then that may be bearish as we could find ourselves with a lower double top 90 weeks from the start of the bear.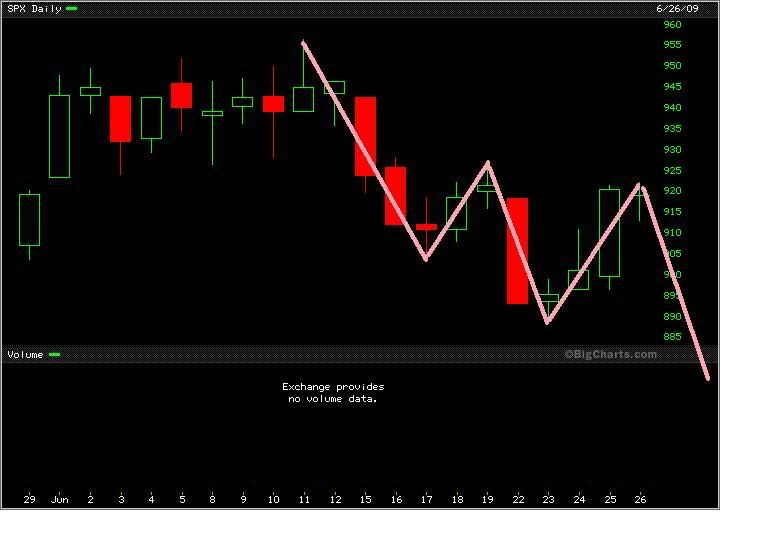
econorama for today, page-39


Add XJO (ASX) to my watchlist
 (20min delay) (20min delay)
|
|||||
|
Last
8,205.9 |
Change
-63.900(0.77%) |
Mkt cap ! n/a | |||
| Open | High | Low |
| 8,269.8 | 8,269.8 | 8,205.9 |
| XJO (ASX) Chart |