TLS
The monthly chart looks good from a simplistic view.
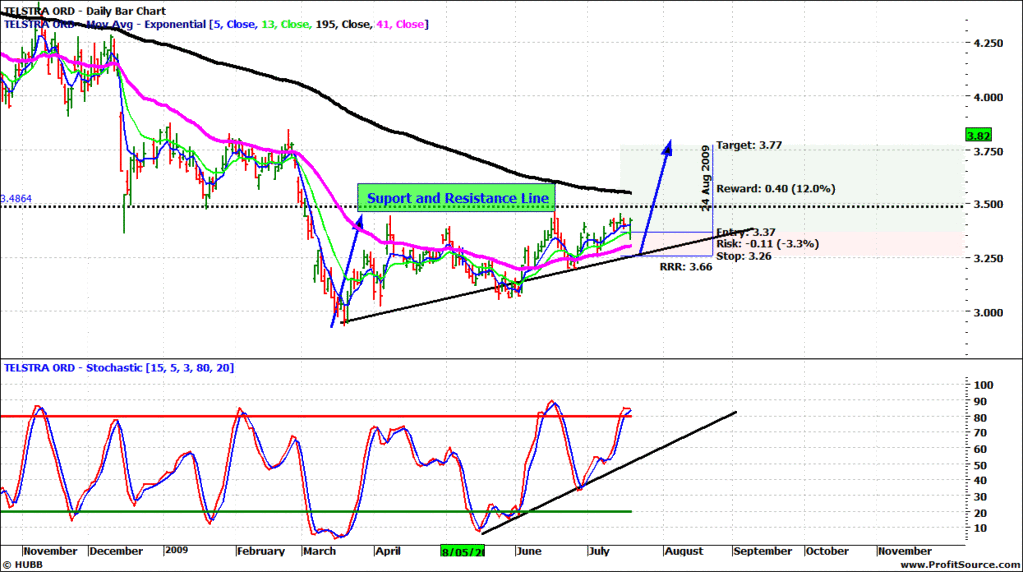
The daily chart also shows the clear support and resistance line and how price has rejected a move above it of late. I have put a risk to reward thought on the trade. Im not sure if the times right but i have liked TLS from the low 3's
The impulse move out above resistance line will be good but patience and timing will be the key. At some stage soon though i would think a touch of the 195EMA is possible.
Regards
Rob
- Forums
- ASX - Short Term Trading
- TLS
- charts
charts
-
- There are more pages in this discussion • 12 more messages in this thread...
You’re viewing a single post only. To view the entire thread just sign in or Join Now (FREE)
Featured News
Add TLS (ASX) to my watchlist
 (20min delay) (20min delay)
|
|||||
|
Last
$3.87 |
Change
0.010(0.26%) |
Mkt cap ! $44.71B | |||
| Open | High | Low | Value | Volume |
| $3.88 | $3.89 | $3.86 | $51.83M | 13.37M |
Buyers (Bids)
| No. | Vol. | Price($) |
|---|---|---|
| 2 | 125807 | $3.87 |
Sellers (Offers)
| Price($) | Vol. | No. |
|---|---|---|
| $3.88 | 100573 | 9 |
View Market Depth
| No. | Vol. | Price($) |
|---|---|---|
| 2 | 125807 | 3.870 |
| 33 | 458791 | 3.860 |
| 55 | 444135 | 3.850 |
| 20 | 249118 | 3.840 |
| 34 | 186629 | 3.830 |
| Price($) | Vol. | No. |
|---|---|---|
| 3.880 | 92444 | 6 |
| 3.890 | 556754 | 30 |
| 3.900 | 560243 | 84 |
| 3.910 | 218403 | 23 |
| 3.920 | 296522 | 40 |
| Last trade - 16.10pm 14/10/2024 (20 minute delay) ? |
Featured News
| TLS (ASX) Chart |
The Watchlist
I88
INFINI RESOURCES LIMITED
Charles Armstrong, Managing Director & CEO
Charles Armstrong
Managing Director & CEO
SPONSORED BY The Market Online


