Hi guys,
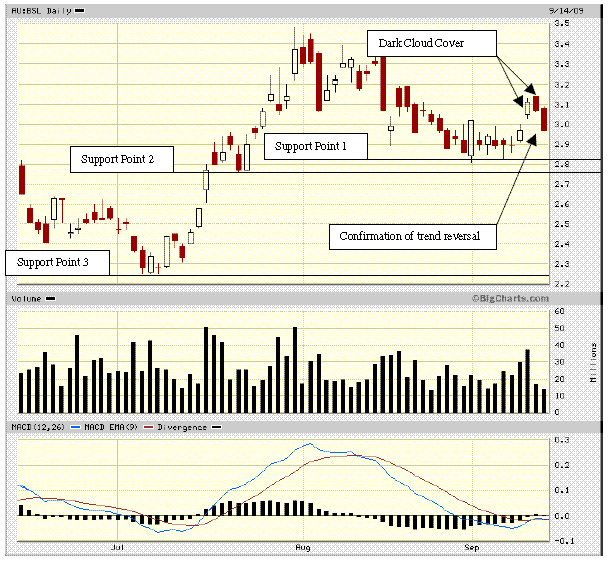
The chart below is a daily one.
It looks like the Dark cloud played out as expected and was confirmed by today's candle. There are a couple of daily supports being at ~$2.80. I hold a small parcel but looking at investing more around there (~$2.80) but I will just wait and see what happens. I may re-invest earlier than that, depends on how it plays out. If it bounces back tomorrow, well, another look at the chart will have take place. The chart is just one tool in many considerations.
Cheers
Please do your own research. I'm only sharing my thoughts with you.

- Forums
- ASX - By Stock
- BSL
- daily chart - trend
BSL
bluescope steel limited
Add to My Watchlist
0.76%
 !
$22.43
daily chart - trend
Featured News
Add to My Watchlist
What is My Watchlist?
A personalised tool to help users track selected stocks. Delivering real-time notifications on price updates, announcements, and performance stats on each to help make informed investment decisions.
 (20min delay) (20min delay)
|
|||||
|
Last
$22.43 |
Change
0.170(0.76%) |
Mkt cap ! $9.838B | |||
| Open | High | Low | Value | Volume |
| $22.47 | $22.64 | $22.18 | $66.53M | 2.955M |
Buyers (Bids)
| No. | Vol. | Price($) |
|---|---|---|
| 1 | 9599 | $22.42 |
Sellers (Offers)
| Price($) | Vol. | No. |
|---|---|---|
| $22.44 | 30000 | 10 |
View Market Depth
| No. | Vol. | Price($) |
|---|---|---|
| 2 | 130 | 22.150 |
| 1 | 1400 | 22.140 |
| 1 | 45 | 22.120 |
| 1 | 340 | 22.100 |
| 3 | 23045 | 22.000 |
| Price($) | Vol. | No. |
|---|---|---|
| 22.540 | 1000 | 1 |
| 22.650 | 1000 | 1 |
| 22.660 | 1000 | 1 |
| 22.700 | 450 | 1 |
| 22.710 | 686 | 1 |
| Last trade - 16.11pm 19/09/2025 (20 minute delay) ? |
Featured News
| BSL (ASX) Chart |


