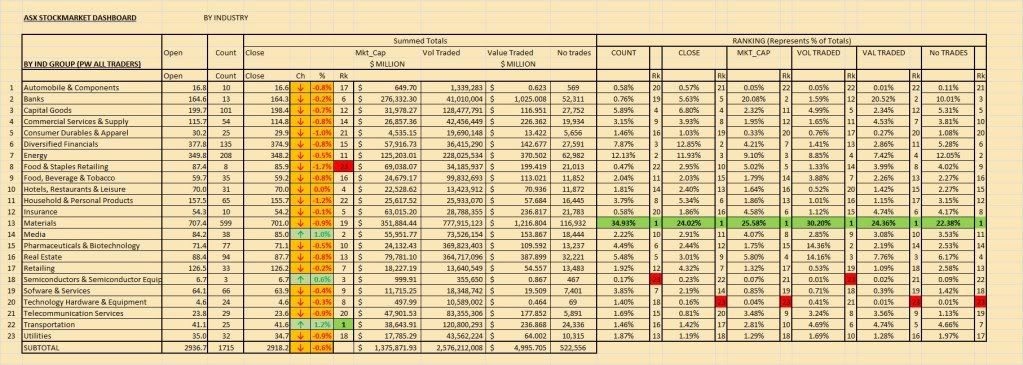
red, the unweighted worst performing sectors of the ASX today (compared to close yesterday) was materials, then financials - this is 60% of the ASX in terms of market cap. combined these 2 lost $6.1Bn off the ASX today (91% of todays market loss).
Are you reading the ASX weighted index calcs? can't say I've ever liked them, I prefer unweighted data myself - see below.
Uses raw trade data for 1715 stocks with liquidity that trades at least weekly. Ranking provided from best (1 = green) to worst (red).
sector - unweighted asx eod 05nov09
industry - unweighted asx eod 05nov09
these are from todays open to close - doesn't count gapping up or down in stocks overnight.
but this one does, as a summary comparison between todays close and yesterdays (in $M of mkt cap)
Should answer your question ...
- Forums
- ASX - By Stock
- XJO
- snippets - 30/10/09
snippets - 30/10/09, page-34
-
-
- There are more pages in this discussion • 19 more messages in this thread...
You’re viewing a single post only. To view the entire thread just sign in or Join Now (FREE)
Featured News
Add XJO (ASX) to my watchlist
 (20min delay) (20min delay)
|
|||||
|
Last
8,199.5 |
Change
67.700(0.83%) |
Mkt cap ! n/a | |||
| Open | High | Low |
| 8,131.8 | 8,224.2 | 8,131.8 |
Featured News
| XJO (ASX) Chart |


