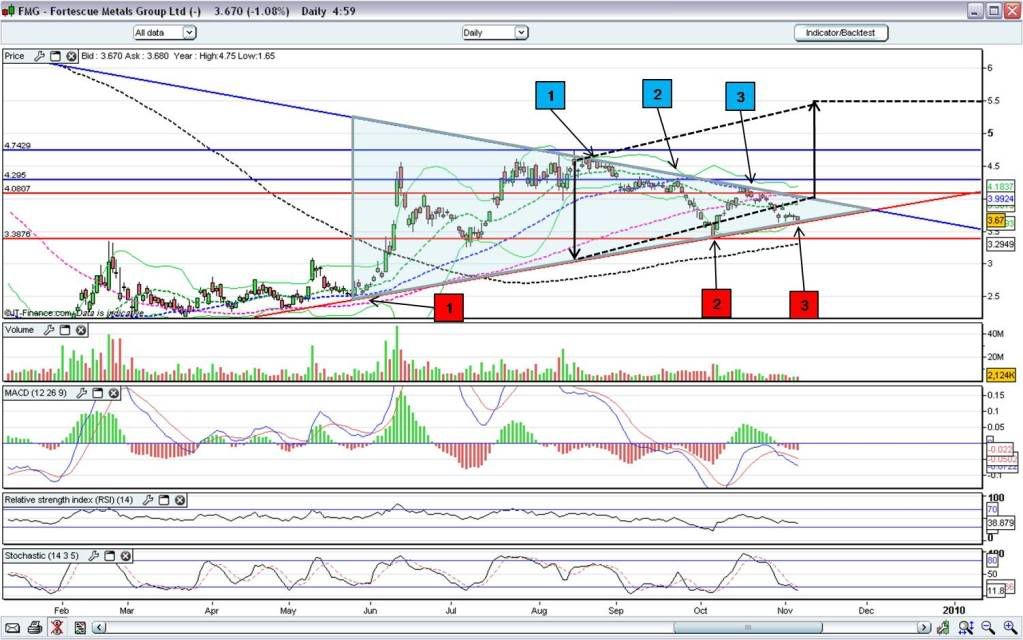
re: australia's greatest value investors says Just thought I'd throw in an updated FMG chart to provide a counter-argument to the bears lurking in the forum:
The key feature of FMG's price movement is the emergence of a symmetrical triangle continuation pattern shown overlaid on the daily price chart. The last 3 peaks and troughs (marked 1, 2 & 3 in each case) form a symmetrical triangle based on the bullish support line initiated with the February low, which the price continues to respect.
The feature of this consolidation pattern is that if confirmed with a breakout to the high side, which would have to occur by early December according to the timescale, then the price target for the breakout would be the same as the height of the triangle from its first peak - in the case of FMG's current pattern that would set a price target of $5.50. I'll put an update of this back up in a month and see how its gone...
Cheers & good luck all FMG holders, Sharks.
- Forums
- ASX - By Stock
- FMG
- re: australia's greatest value investors says
re: australia's greatest value investors says, page-4
-
- There are more pages in this discussion • 6 more messages in this thread...
You’re viewing a single post only. To view the entire thread just sign in or Join Now (FREE)
Featured News
Add FMG (ASX) to my watchlist
 (20min delay) (20min delay)
|
|||||
|
Last
$19.17 |
Change
-0.020(0.10%) |
Mkt cap ! $59.02B | |||
| Open | High | Low | Value | Volume |
| $19.22 | $19.41 | $19.13 | $134.6M | 6.997M |
Buyers (Bids)
| No. | Vol. | Price($) |
|---|---|---|
| 1 | 52 | $19.15 |
Sellers (Offers)
| Price($) | Vol. | No. |
|---|---|---|
| $19.20 | 1239 | 2 |
View Market Depth
| No. | Vol. | Price($) |
|---|---|---|
| 1 | 52 | 19.150 |
| 2 | 2500 | 19.140 |
| 1 | 3333 | 19.130 |
| 1 | 500 | 19.120 |
| 3 | 2190 | 19.110 |
| Price($) | Vol. | No. |
|---|---|---|
| 19.200 | 1239 | 2 |
| 19.240 | 100 | 1 |
| 19.250 | 16644 | 4 |
| 19.260 | 5100 | 2 |
| 19.270 | 2224 | 2 |
| Last trade - 16.10pm 31/10/2024 (20 minute delay) ? |
Featured News
| FMG (ASX) Chart |


