Has anyone used this, why I ask is this could be very handy for our weekend charting and possibly open up say a 2 hour window where we chat and discuss our charts.
Sometimes when you post a chart, Im not sure if im answering the question, and in Lucky's case that's the reason I asked for thoughts as I wasnt sure where Lucky was at with her trades.
Im going to download it and have a play.
Regards Rob
A few more examples to share of watching for those repeating ranges and knowing where longer term support lines sit. One of these support lines on the Dow is at 9660ish, As you can see it came and touched it and then on the 2nd attempt produced a buy, then using measured range up she went to hit target, and then has it retraced, it came down to touch the upside of the downtrend breakout line, as well as supporting on the 195EMA producing another buying opportunity. Now the 2nd buy came after the late sell off and many would suggested thats was a very bearish close ??, but have a close look at the SPY chart and you will see it was merely filling the gap from the morning opening and bounced straight off it. Some will also say, your against the trend and things are all bearish, my thought always is and always will be that , if risk is measured and you have repeating ranges the odds favour the simpletons everytime
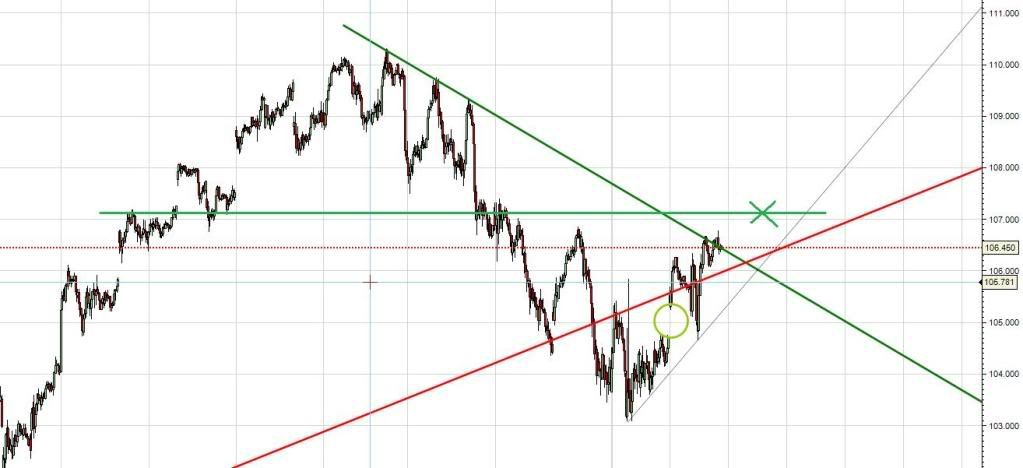
The X is marking the close Sat morning and also see its a key SnR line. Circle is the gap i was talking about above.