??? How so pattyp ??? Please explain ...
Volt - we seem to have entered a similar Aussie200 cash period as ended on 27Nov09. Lasted 8 days - this one maybe 3 days remaining, then down??? (Using IGM)
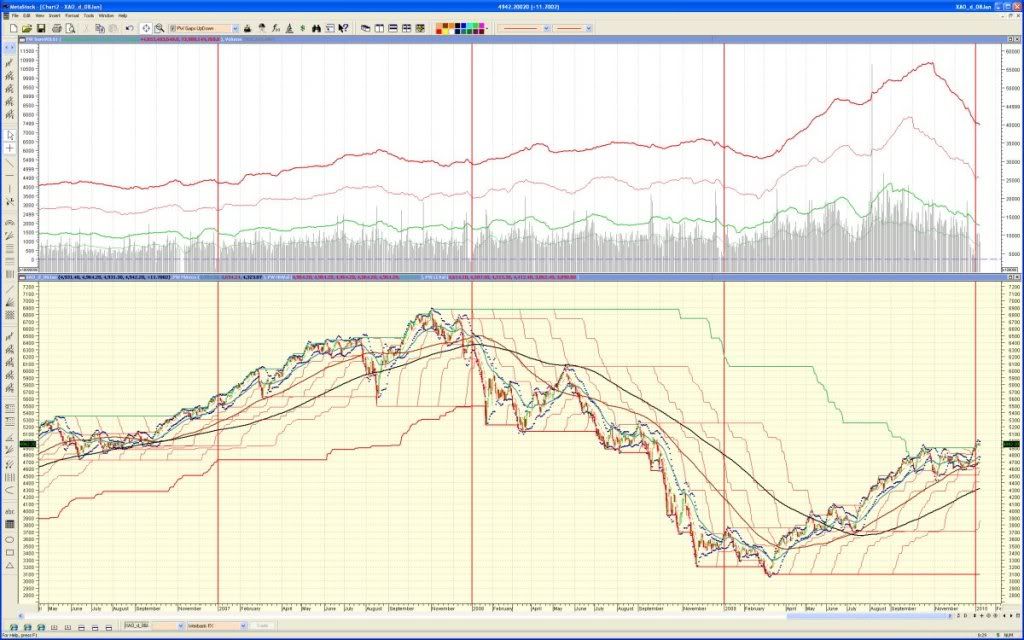
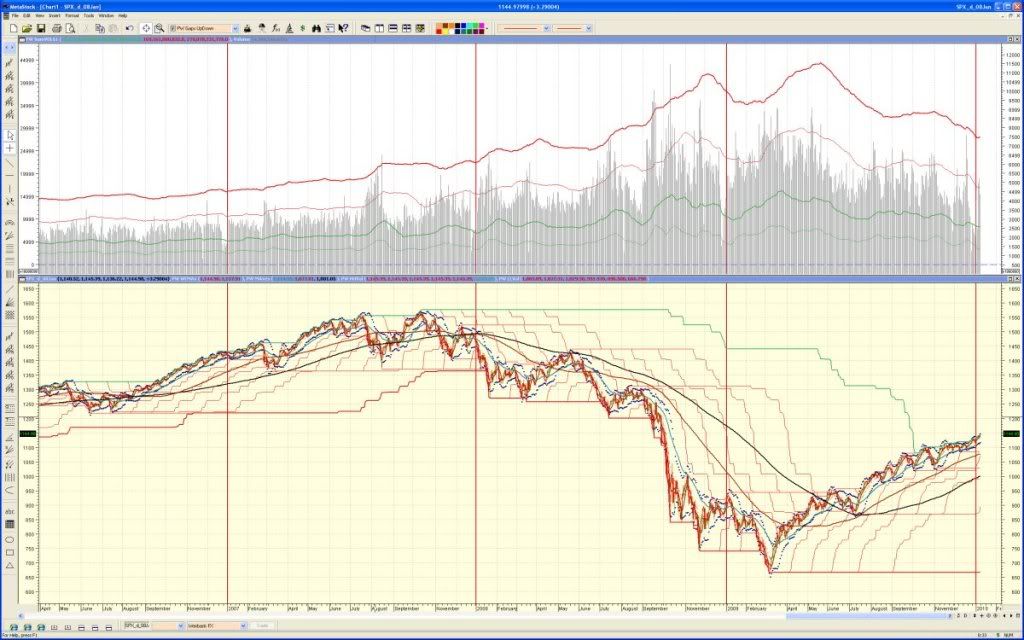
I did these volume charts (below) for XAO and SPX; our increase is marginal/roughly on a par compared to the volume through the SPX. Mind you, the data is from finance.yahoo ....
I am forming an opinion that higher volumes cause price turnovers/corrections quicker.
First the accumulation to a peak, then a selloff based on the time & volume of the build up. More volume during the selloff might cause the crash to happen more quickly .... or not.
A bit like getting it over and done with ...
rgds,
pw
(upper portion is volume trends, thick red line is 3 monthly cummulative)
XAO showing volume -
SPX showing volume -
SUMMARY -
Volumes as measured at end of year (for simplicity)
XAO
2006/07 42.7 Bn per 3 months
2007/08 52.4 Bn per 3 months (incr 22.7%)
2008/09 61.9 Bn per 3 months (incr 18.1%)
2009/10 75.4 Bn per 3 months (incr of 21.8%)
(peaked at 107.8Bn in late Oct09 = 2.5x starting value)
compared with -
SPX
2006/07 161.5 Bn per 3 months
2007/08 224.2 Bn per 3 months (incr 38.8%)
2008/09 379.2 Bn per 3 months (incr 69.1%)
2009/10 282.2 Bn per 3 months (decr of 25.5%)
(peaked at 441.7 in late May09 = 2.73x starting value)
Am not sure if the volume peaks are significant markers ... but I'm guessing the 'smart money' left the market in the early peaks.
- Forums
- ASX - By Stock
- XJO
- mondayitis
XJO
s&p/asx 200
Add to My Watchlist
1.37%
 !
8,757.2
mondayitis, page-97
Featured News
Add to My Watchlist
What is My Watchlist?
A personalised tool to help users track selected stocks. Delivering real-time notifications on price updates, announcements, and performance stats on each to help make informed investment decisions.
 (20min delay) (20min delay)
|
|||||
|
Last
8,757.2 |
Change
118.200(1.37%) |
Mkt cap ! n/a | |||
| Open | High | Low |
| 8,639.0 | 8,776.4 | 8,639.0 |
Featured News
| XJO (ASX) Chart |


