
Yesterday in Australia.
After a weak start, XJO climbed higher to finish up +0.77%.
The chart show a short-term buy signal on the Hull MA13.
RSI(14) is back above the 30 level which is another short-term buy signal.
Yesterday saw the best breadth figures for the ASX since early March. Advances 988, Declines 476. Net A-D = 512. 9/3/22 saw a Net A-D of 523. That kicked off a rally which saw the XJO rise by 9% finishing on 21/4/22. I'm not suggesting that we will see something similar this time, but it is promising.
Yesterday's move brings the XJO up to the first line of horizontal resistance and the 8-Day EMA. Given events overseas last night, those two resistance levels will probably be overcome taking the XJO up to the Tenkan Sen (Conversion Line) of the Ichimoku system.
XJO is in a counter-trend rally - until proven otherwise. Until the chart gets back above the Kumo cloud, rallies will probably be sold into at key resistance levels.
Overnight in the U.S.
Dow Jones +2.68%. SP500 +3.06%. Nasdaq +3.34%. Small Caps +3.1%. Banks +4.44%.
SP500.
SP500 has given short-term buy signals on the Hull MA13 and 8-DEMA.Wide positive divergence on Money Flow Index was a leading indicator for the current move to the upside.Last night's big move brings the SP500 up to a horizontal resistance level and resistance of the Kijun Sen (Base Line) of the Ichimoku system. We might see some consolidation here.Commodities.
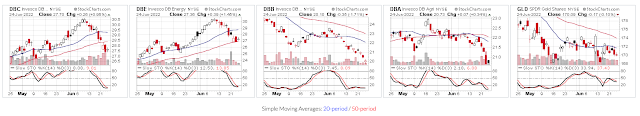
Results in Commodities were mixed.Commodities Index +0.95%. Energy +1.45%. Base Metals continued their long fall -1.71%.Agriculture +0.34%. Gold flat -0.1%.Monday should be good. XJO++.
Indices 20/06, page-152


Add XJO (ASX) to my watchlist
 (20min delay) (20min delay)
|
|||||
|
Last
8,084.5 |
Change
60.600(0.76%) |
Mkt cap ! n/a | |||
| Open | High | Low |
| 8,023.9 | 8,086.7 | 8,023.9 |
| XJO (ASX) Chart |