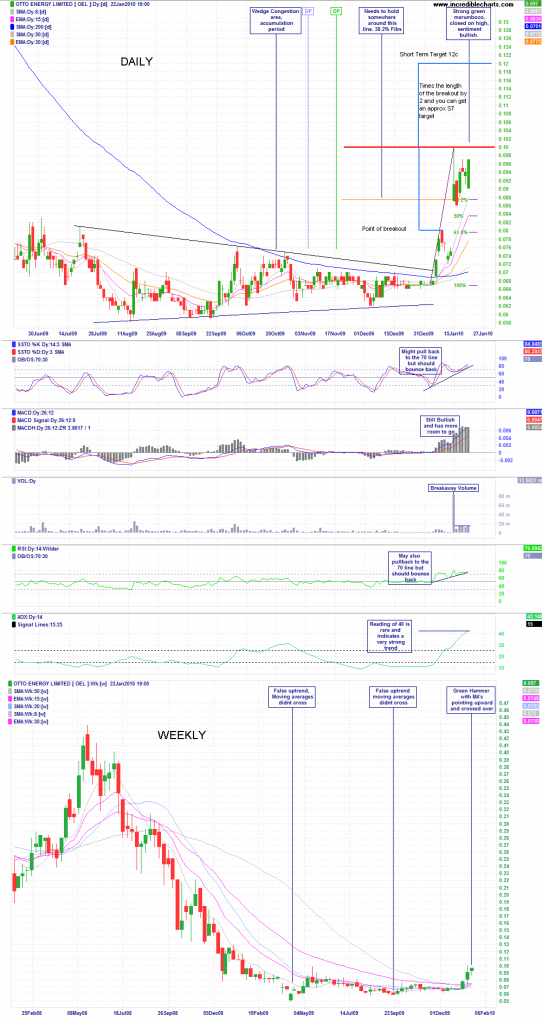
Carabaea, Here is a chart for you, I dont usually post my analysis on hotcopper often cause I tend to get annoyed with posts such as TA is useless bla bla bla but the OEL thread is pretty quiet and civil at the moment so I thought id give it another go.
Basically on the daily I am willing to make the call that the gap will not be filled unless a negative fundamental change occurs, most likely to do with BHP pulling out or something like that. If a breakaway gap doesnt fill within the first three days its likely it wont get filled at all unless of course the above occurs.
Stochastics and RSI are hovering around the overbought mark but I wouldnt look too much into this at this stage as buy volume is steady, if anything you may see a small pullback to the 70 line or even the 50 line as some swing traders start to take profits once they start trading the uptrend trend channel between the Bollinger bands and the EMA.
Whats interesting is that the ADX which is a trend following indicator is giving a reading of 40, this is a rare sign and a very strong indication that the trend is powerful.
You can get a general target by 2x the length of the breakout, which would make sense and be realistic on a break of the 10c mark, so 12c if she breaks the 10c mark, longer targets well who knows maybe 15-20 cents depending on fundamental changes, firstly she needs to break that 10c level and close above it on good volume.
The previous false pump and dumps were obvious if you were following the weekly charts, the Moving averages hadnt crossed and were pointing down and no volume to back up the strength of the trend. Now the situation is different.
Im long on this stock and mostly interested with the weekly at this stage, solid green hammer with MAs crossed and pointing upward, and all indicators pointing up with more room to move. Looks like the stars have aligned with galoc phase 2 coming soon, first gas from turkey also.
- Forums
- ASX - By Stock
- OEL
- chart for carabaea
chart for carabaea
-
-
- There are more pages in this discussion • 11 more messages in this thread...
You’re viewing a single post only. To view the entire thread just sign in or Join Now (FREE)
Featured News
Add OEL (ASX) to my watchlist
 (20min delay) (20min delay)
|
|||||
|
Last
1.2¢ |
Change
-0.001(7.69%) |
Mkt cap ! $57.54M | |||
| Open | High | Low | Value | Volume |
| 1.2¢ | 1.3¢ | 1.1¢ | $7.407K | 617.5K |
Buyers (Bids)
| No. | Vol. | Price($) |
|---|---|---|
| 2 | 203600 | 1.2¢ |
Sellers (Offers)
| Price($) | Vol. | No. |
|---|---|---|
| 1.3¢ | 2102708 | 4 |
View Market Depth
| No. | Vol. | Price($) |
|---|---|---|
| 2 | 203600 | 0.012 |
| 15 | 17673150 | 0.011 |
| 6 | 8650000 | 0.010 |
| 1 | 500000 | 0.009 |
| 2 | 1125124 | 0.008 |
| Price($) | Vol. | No. |
|---|---|---|
| 0.013 | 2102708 | 4 |
| 0.014 | 9779614 | 12 |
| 0.015 | 4305776 | 7 |
| 0.017 | 233300 | 1 |
| 0.019 | 1500000 | 1 |
| Last trade - 16.10pm 04/11/2024 (20 minute delay) ? |
Featured News
| OEL (ASX) Chart |


