Hi, been watching w/end trading for months & decided to dip my toe in the water to share some charts of XJO. I have been playing with TA for about 6 months & learnt heaps from this site!!! Better than all the books I have read IMO!
soooo I welcome all feedback ... no such thing as BAD feedback. all learning IMO
basically I am using TA to try and detect trends and to enter long term trades that catch the trend "The trend (really really ) is your friend"
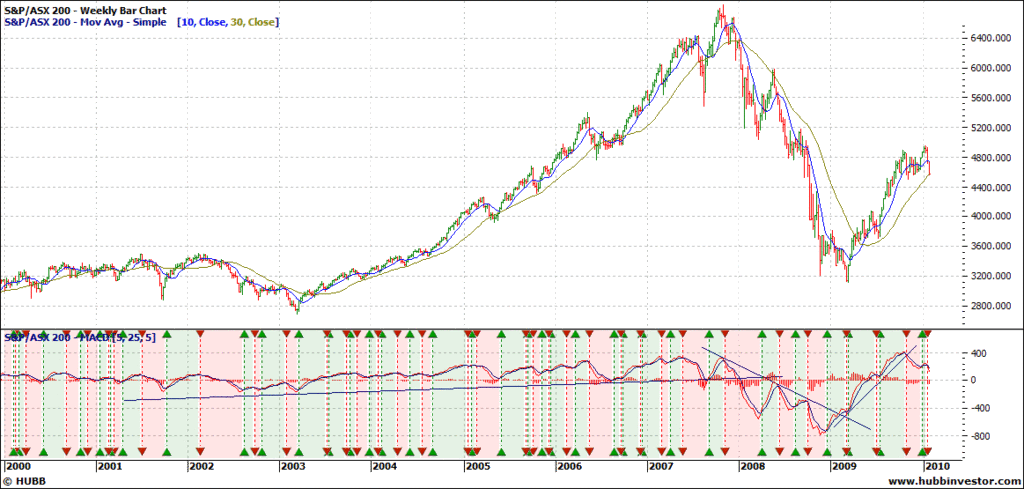
First lets look at 10 years of xjo. see below.
My observations: For me this chart just confirms how a simple 10 & 30 ma can be effective at defining the trend; what sort of dick would have stayed in market after the 10 and 30 cross beginning 2008??? ... guilty as charged your honour ... thats why I am NOW interested in TA ... I do not know of any of the expert FA'ers (bankers, brokers, economists etc.) out there that called the market correction correctly ..... & if they did it was way to late.
I note also thatMACD was accurate at defining trends and the current down ward movement has price sitting right on 30 week MA; although good separation between 10&30 remains the 10 1ill turn down very quickly if weekness continues.
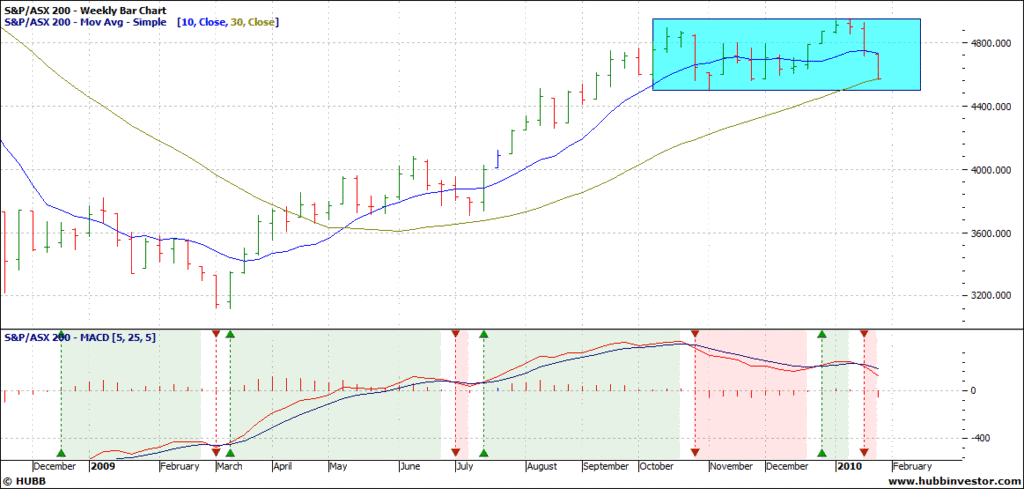
next chart show 12 months weekly and the consolidation that has occurred for last 4-5 months .. also of interest to me is that we were at these levels not that long ago .. early Dec .. & yet IMO sentiment at the moment is a lot "shakier" than then. Probs difference between psychology of rising to a level vs falling to that level????
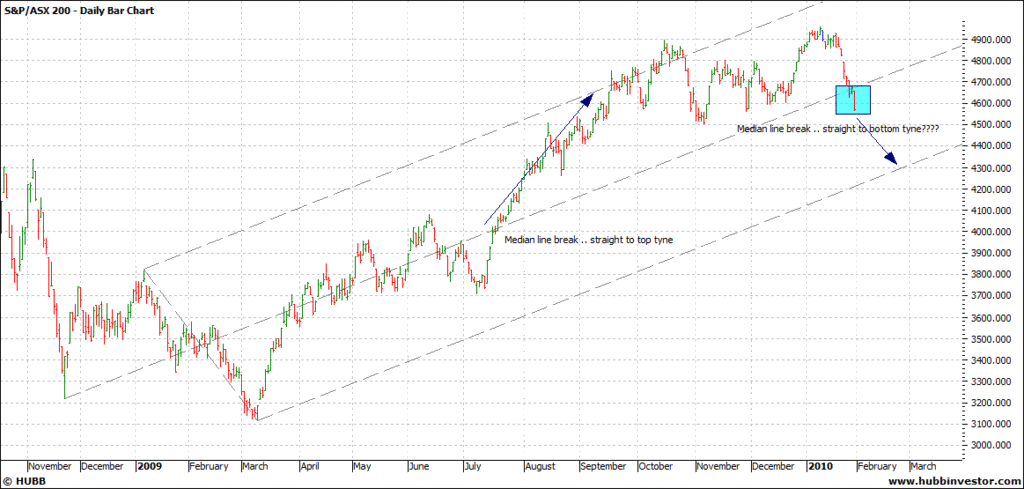
I have spent lots of time trying to define trends, simple trend lines, channels etc & recently (inspired through the great work of totterdell91, thanks again) got very interested and been playing with pithforks ... love 'em .. amazing (uncanny??) ability to define trend channels & concept of median price appeals to me!! Lets look at the 2009n bull market. see daily chart below:
My observations: Note how bars surround med line initially (mar-july)& then when it "breaks" med line head straight up to upper tine. It has now broken the med line again on the down side ... does this signal a return to lower tine? About 4300?
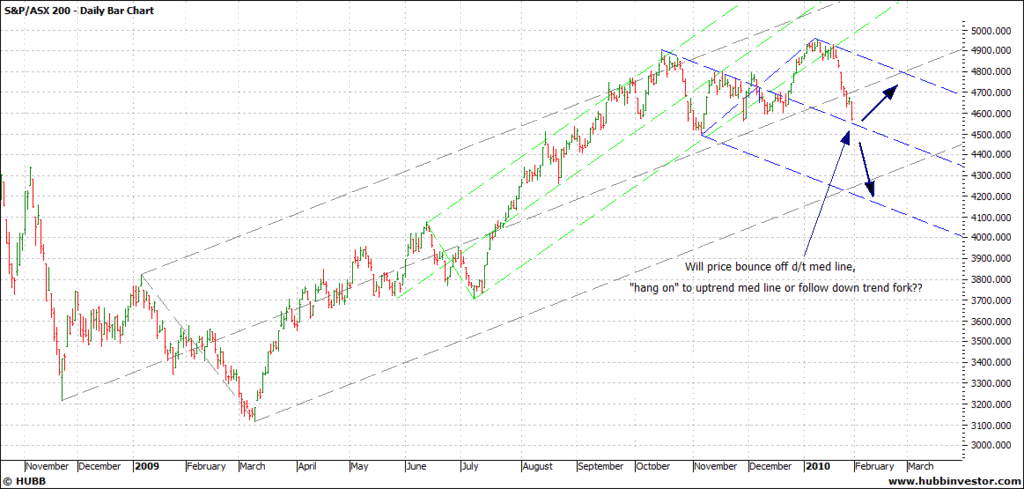
like the pitch forks so add a few more to help define the finer trends (love someone to feedback whether I am drawing them correctly?? Seeing pithforks everywhere on my charts. Even starting to dream about pichforks LOL!!!) Green is intermediate u/trend and blue recent d/t
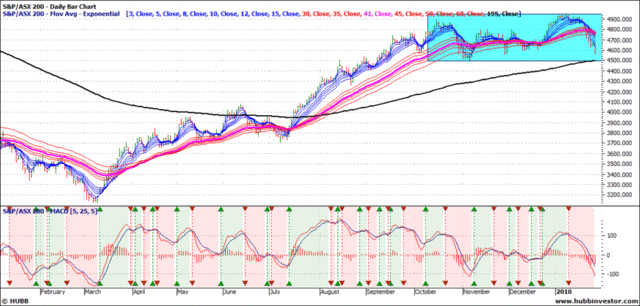
read mr guppys stuff and below we check some ema's against the trend ... for gmma fans I substituted the 40ema with the HC favourite pink 41 ema and added the 195, (not sure why but seems to be HC norm; any reason?? ... if its good enough for Robbbb good enough for me? LOL)
Observations: Not convinced on the gmma (others opinion??) however the 41ema has been breached and the 195 is looming!!! maybe as support??
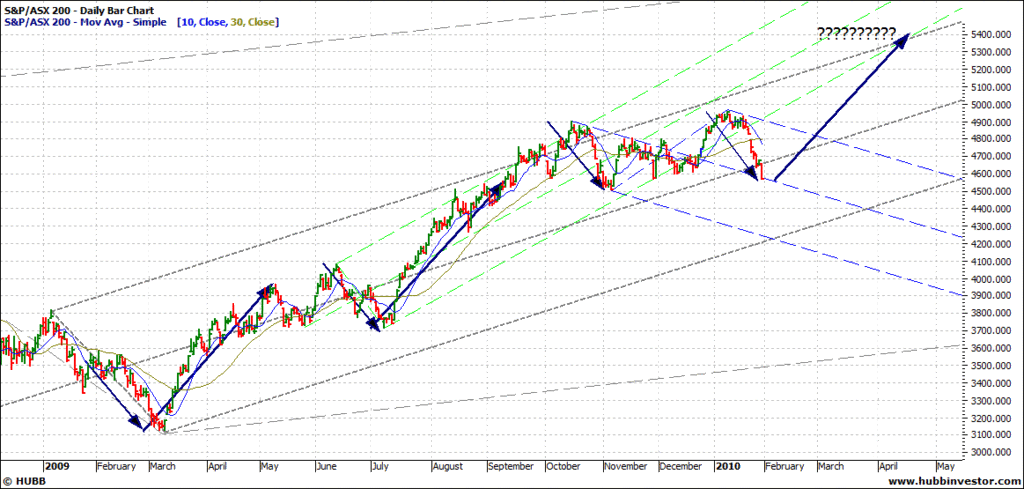
... finally also been taken by Master Robbbbs work on repeating ranges and time frames. I noticed how there has been a correctiion of similar magnitude about every 4 months starting fed 09 & similarly 2 uptrends of similar magnitude(see blue arrows below)... could we be forming the base of the next leg up??? If so it (coincidentally???) matches the upper tine of our overall uptrend p/fork at about 5400.
So thats it for me ... i hope some peops bother to read this & I get some responses ..... although I am generally a LT holder thinking of making substantial (for me!!! All $$$$ from my SMSF + personal$$) exit from market in next week if the -ive scenarios above play out?
Hope I am on teh right track????
- Forums
- ASX - General
- weekend charting 29-01-10
weekend charting 29-01-10, page-127
-
- There are more pages in this discussion • 70 more messages in this thread...
You’re viewing a single post only. To view the entire thread just sign in or Join Now (FREE)


