Hi All
A review of some charts requested so far this weekend. Im trying a new method of linking the charts to keep the post size smaller the chart thumbnails should be clickable, which will pop up a full size image for the ones you are interested in.
Charts include: MEO, LEI, CPL & KAR
Declaration: No holdings in any of the above.
MEO (for joandjas):
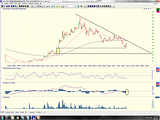
I posted a chart on MEO a few weeks ago when it was sitting around the 0.45 level right on the 195 EMA and commented it could go either way at that stage. Its now failed support at that level, and following the downtrend line established from the September peak. Theres not much support underneath the current price until around 0.22 which is last Julys low, and represents current downside risk imo. The MACD shows positive movement based primarily on Thursday strong gain. Will need to see that downtrend resistance tested and broken, and preferably also a higher swing bottom establishing a trend change before considering an entry I would think. Initial upside target if that happens would be the 0.53 January peak.
LEI (for myself):
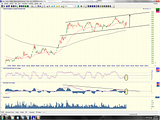
This wasnt a request but I saw someone here refer to it and I was doing some FA on BLY so thought I would have a look. LEI has that nice bullish channel going and while its attractive because Fridays close is not too far above that lower trendline, its below the 41 EMA also. Both the 41 & 195 EMA are still trending higher indicating the bullish trend still has solid legs. The MACD has a possible longish term divergence to price since the start of the bullish channel, but I suspect thats possibly an artefact of the strong advance through July/August last year rather than a warning of a reversal. That channel has a height of about $6.50 or 15%. Good potential for range trading if the right entry point is found, and based on LEIs recent profit upgrade theres upside potential rather than downside risk imo.
CPL (for marvdog):
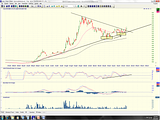
CPL has quite an attractive looking chart imo. It has clearly shown strong growth in August-October off a very low base last April, and looks to have consolidated now after a cap raising in November triggering the retreat in price from Octobers peak. Although Ive included a downtrend resistance line from the October peak, theres some room for interpretation on the lower contact points of that resistance line. The ones Ive chosen suggest that price has managed to stick its head above that resistance with Fridays strong performance. While theres congestion in the price over the last 2 months I think theres a valid bottom and higher swing bottom in the formation, as highlighted. The 41 & 195 EMAs are both trending positively now too, and the Stoch is trending up. Overall the chart suggests CPL is now in an uptrend with bullish trendline support underneath it, and the mid-term target has to be 0.45 from its current price of 0.37, representing an upside target of 20%. With a negative lead from Wall St suggesting a negative open in our markets on Monday, I might be putting this one near the top of my watchlist if it can be picked up at around 0.35-0.36.
KAR (for john435):
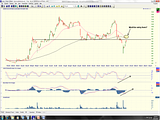
It looks like the bounce trade off the poor market reaction to mid-Jan exploration report has very little or no potential left as price has now returned almost fully to that congestion area around 7.50-8.50. Now is not the right time to enter this one imo. While indicators look positive based on the strong bounce, I suspect a better place to enter would be to wait for price to break through to the 195 EMA which price used as support for most of that congestion period from October - December.
Cheers all, Sharks.
- Forums
- ASX - General
- weekend charting 13/14 feb
weekend charting 13/14 feb, page-35
-
- There are more pages in this discussion • 86 more messages in this thread...
You’re viewing a single post only. To view the entire thread just sign in or Join Now (FREE)


