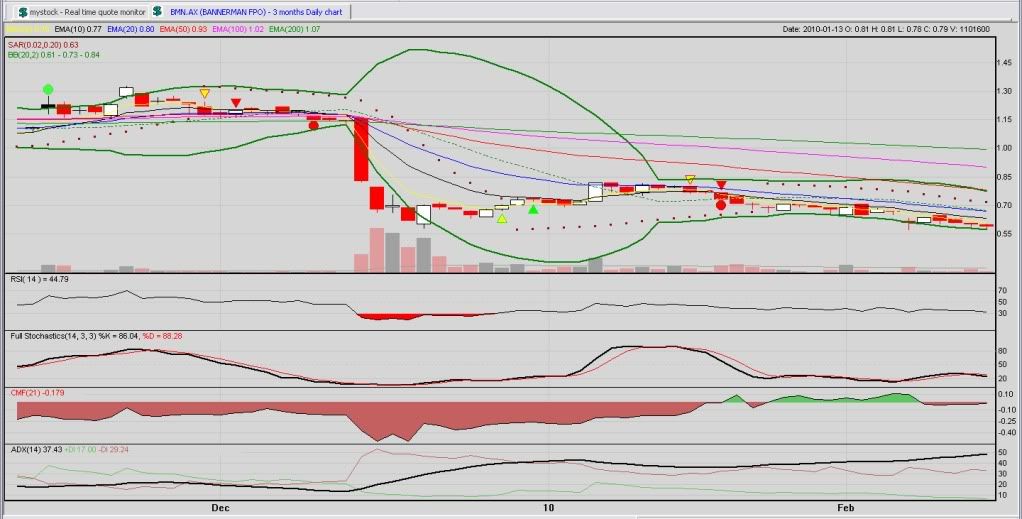
this may help . Its an auto generated chart that i subscribe to. 4 buy and sell signals
yellow shows beginning of up or down trend. red triangle with red circle shows strong downtrend and shows bollingers breaking to downside. I will look for a yellow triangle again for a safe entry
- Forums
- ASX - By Stock
- BMN
- fresh lows
BMN
bannerman energy ltd
Add to My Watchlist
11.6%
 !
$3.75
fresh lows, page-37
Featured News
Add to My Watchlist
What is My Watchlist?
A personalised tool to help users track selected stocks. Delivering real-time notifications on price updates, announcements, and performance stats on each to help make informed investment decisions.
 (20min delay) (20min delay)
|
|||||
|
Last
$3.75 |
Change
0.390(11.6%) |
Mkt cap ! $770.2M | |||
| Open | High | Low | Value | Volume |
| $3.59 | $3.89 | $3.59 | $9.620M | 2.564M |
Buyers (Bids)
| No. | Vol. | Price($) |
|---|---|---|
| 1 | 4250 | $3.70 |
Sellers (Offers)
| Price($) | Vol. | No. |
|---|---|---|
| $3.75 | 461 | 1 |
View Market Depth
| No. | Vol. | Price($) |
|---|---|---|
| 1 | 4250 | 3.700 |
| 1 | 281 | 3.550 |
| 1 | 706 | 3.540 |
| 1 | 1000 | 3.360 |
| 1 | 1888 | 3.330 |
| Price($) | Vol. | No. |
|---|---|---|
| 3.750 | 461 | 1 |
| 3.760 | 26000 | 1 |
| 3.800 | 25970 | 5 |
| 3.820 | 5235 | 1 |
| 3.850 | 2098 | 3 |
| Last trade - 16.10pm 16/09/2025 (20 minute delay) ? |
Featured News
| BMN (ASX) Chart |


